

Scroll Up Top
Print icon
Print

In a macro environment characterized by higher growth, higher interest rates and divergent demand drivers, investors need to target industries and real assets which take advantage of pockets of outsized growth. This growth will likely be closely aligned to long-term thematics including AI capex, manufacturing reshoring, and higher defense spending. Equities aligned with these mega trends have delivered +50% compounded annual growth over the last three years while industrial property values remained broadly flat.1

The cyclical operating environment appears to have moved beyond its inflection point

Net absorption over the last four quarters in the main U.S. industrial markets was healthy at >260M SF and exceeded pre-Covid normal annual absorption of 225-250M SF, according to CBRE Research. Industrial demand is accelerating across regions, as LTM demand in Q2 2026 was 2x the pace of growth in Q2 2025.2 National vacancy fell 10 basis points to 6.5% y/y and most excess availability across markets falls within the mid-sized boxes between 100-700K SF – a supply glut from the Covid-era of 2021/2022. Construction activity fell -60% from the Covid-era peak and new quarterly development starts averaged a subdued 50M SF quarterly for the last three years.3 As industrial demand ramps and limited development pipelines deliver, it appears that the U.S. industrial market has passed its cyclical inflection point, offering a compelling market setup for NOI growth over the medium-term horizon.

New Industrial Leasing Volume, United States
M SF, New Leases >10K SF (excludes Renewals)

Coastal market weakness in recent years masked the overall strength of U.S. industrial demand; New leasing volume in 2026 is on track to exceed Pre- Covid levels by ~50%.
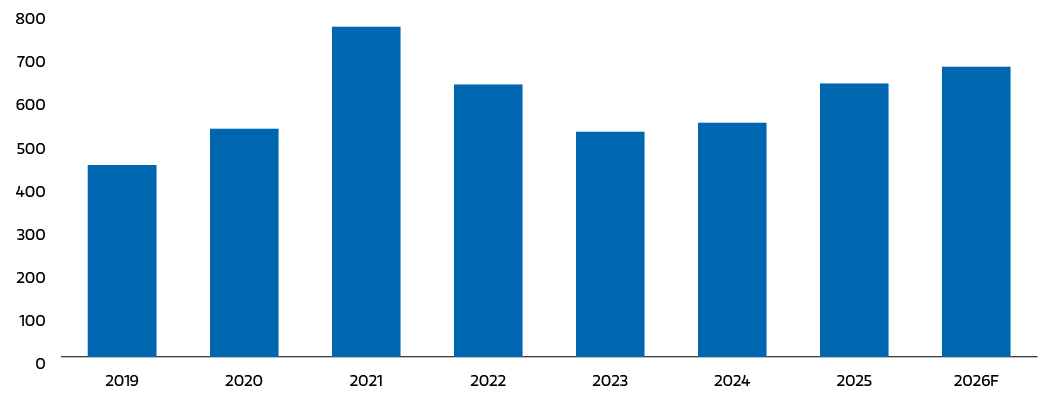
EXHIBIT 1
insight_us-industrial-leasing-volume_e1.jpg

Source: CBRE Research

Demand Rate v. Supply Rate, United States
%, LTM Net Absorption as a % of Stock versus Speculative Development Under Construction as % of Stock

Improved demand across all regions over the last 12 months and outstripping development
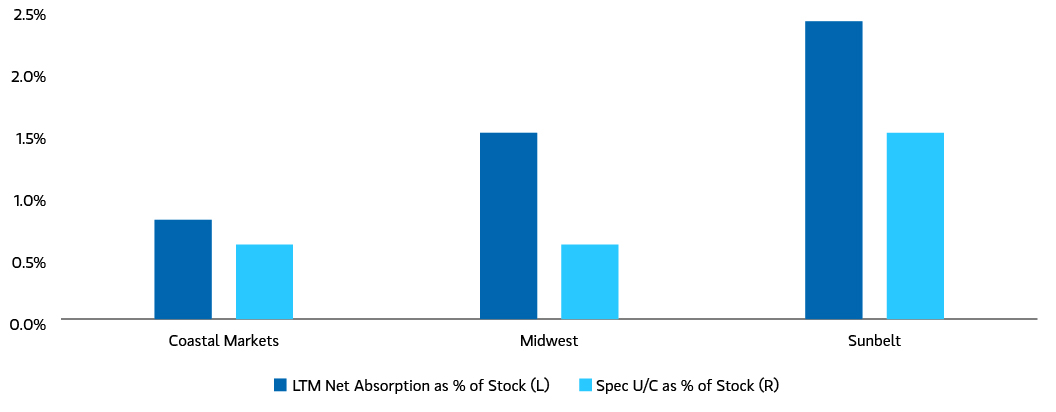
EXHIBIT 2
insight_us-demand-rate-vs-supply-rate_e2.jpg

Source: CBRE Research, MSREI Strategy

Emerging structural drivers in view

We highlight three emerging structural tailwinds shaping the ongoing U.S. industrial super-cycle:

1. Data center suppliers: The ecosystem of tenants serving the data center capex buildout is spurring demand for industrial real estate. In the upstream AI supply chain (e.g., semiconductors, equipment development, power innovation, server testing), industrial R&D demand is spiking in a few highly constrained coastal innovation clusters, led by Silicon Valley. As an example, market rental rates for functional product in Fremont, CA increased by nearly 20% y/y in Q2 2026.4 Supply is severely constrained for heavy powered facilities with excess parking which underpins the growth. In the locations in close proximity to data center clusters, industrial real estate demand spurred by derivatives of the data center capex spend is driving outsized demand in new markets. For example, an ecosystem of data center adjacent suppliers accounted for 30% of gross leasing volume in Dallas since Q4 2024, and 40% of bulk leasing (>700K SF), according to Stream Realty. Examples range from construction service users to bulk distribution facilities leased directly to hyperscalers and 3PLs for hardware storage. Similar leasing trends are present in Virginia, and certain Midwest markets including Ohio and Kansas City. New data center-adjacent industrial demand in these clusters has offset weaker-than-normal demand in recent years from traditional logistics real estate users. For example in Dallas, data center-related bulk industrial leasing exceeded 7 million square feet over the last 12 months, accounting for nearly all of the market’s increase in leasing activity compared with pre-COVID norms.5


Hyperscaler Bottoms Up Capex Spend ($bn)
Hyperscaler Capex Expected to Reach $1tr in 2027; >$2tr Invested. Since 2024
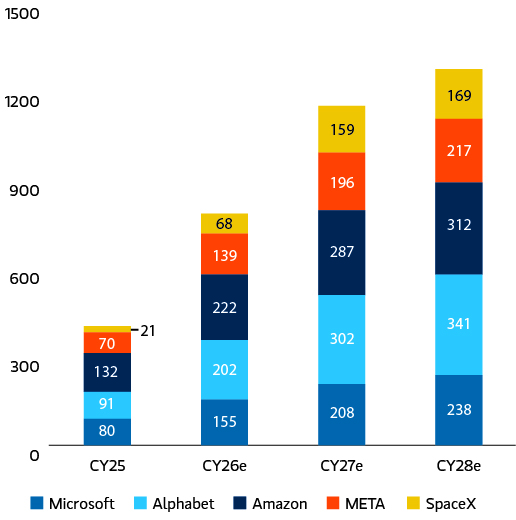
EXHIBIT 3
insight_hyperscaler-bottoms-up-capex-spend_e3.jpg

Source: Company data; Morgan Stanley Research Estimates

%, Data Center Support as % of Industrial Leasing
Data Center adjacent leasing share accounts for a meaningful and rising share of industrial leasing actitivity in certain DC markets
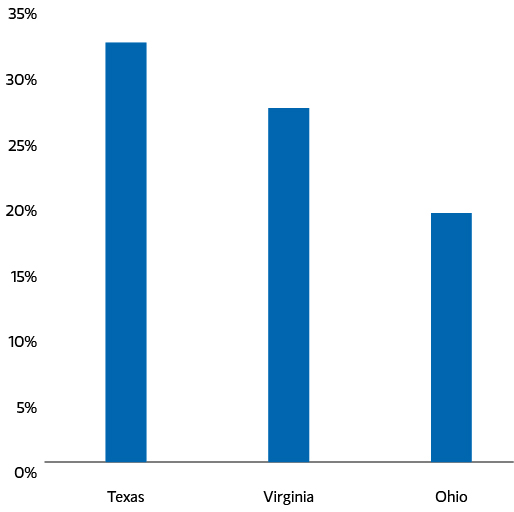
EXHIBIT 4
insight_data-center-support-of-industrial-leasing_e4.jpg

2. Artificial Intelligence adopters: Adopters of AI technology and next generation automation equipment are fueling demand for modern large bulk facilities (>1M SF). Next generation warehouse automation technology requires modern building specifications and allows tenants to drive meaningful throughput and labor cost savings. Examples of warehouse automation technology includes Automated Mobile Robots (AMR), inbound conveyance systems, shuttle-based Automation Storage and Retrieval Systems (AS/RS), and automated packaging systems. Industry adoption varies by product sortability / SKU sales velocity, but may allow certain tenants to dramatically increase pick productivity and reduce labor costs. Bulk leasing activity (>1M SF) was 41M SF in H1 2026, 2x the pace of leasing activity in H1 2025.6 E-commerce users accounted for 50% of the bulk leasing volume and driving the adoption of warehouse automation technology.7U.S. bulk market vacancy is severely constrained with only 12 modern bulk facilities currently under construction available for lease. Tenants are now being forced to pre-lease planned projects which will deliver in 2027 / 2028. AI may accelerate e-commerce sales growth to ~11% per annum, up from post-COVID (last five years) annual growth rate of 8% per annum. In total, industrial demand from tenants associated with AI enablers and adopters each account for about 10-20% of total industrial leasing activity today. As AI continues to advance and integrate into the physical economy, it is likely we will continue to see outsized growth in select markets and real estate size categories.8

Bulk Leasing Volume (>1M SF), United States
M SF

35 bulk leases >1M SF signed in H1 2026 and 2x the pace of H1 2025 (18 signed)
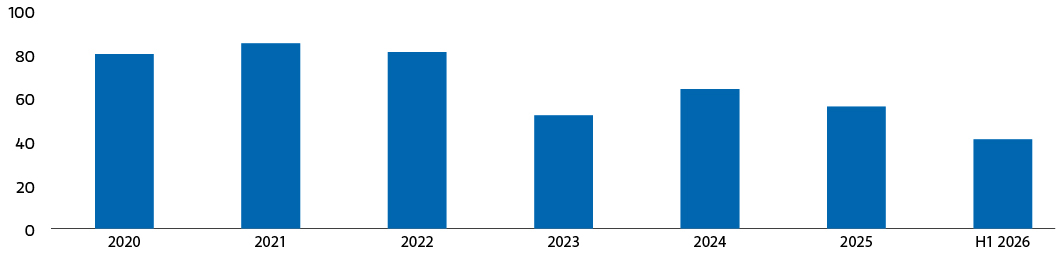
EXHIBIT 5
insight_us-bulk-leasing-volume_e5.jpg

%, Market Vacancy by Size, United States
Frictional vacancy for bulk industrial
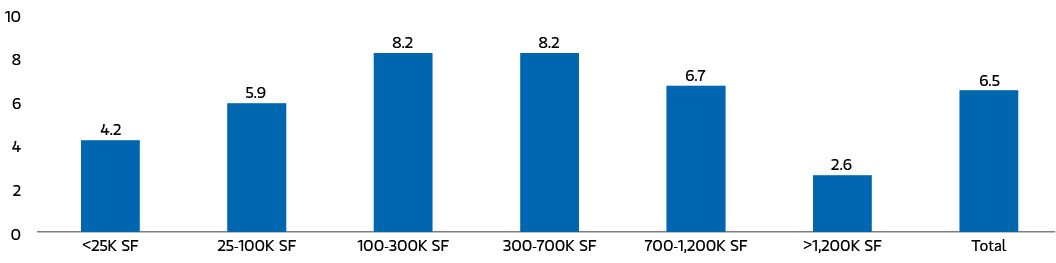
EXHIBIT 6
insight_market-vacancy-by-size_e6.jpg

H1 2026 Manufacturing Leasing by Occupier Type, United States
Structurally adjacent industries underpin rising demand for manufacturing real estate
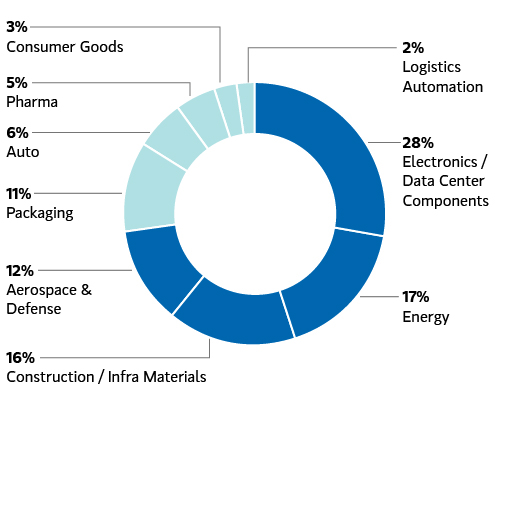
EXHIBIT 7
insight_us-h1-2026-manufacturing-leasing-by-occupier-type_e7.jpg

Source: CBRE Research; >100K SF Leases

Active U.S. Manufacturing Requirements
M SF

Manufacturing accounts for 19% of total active industrial requirements
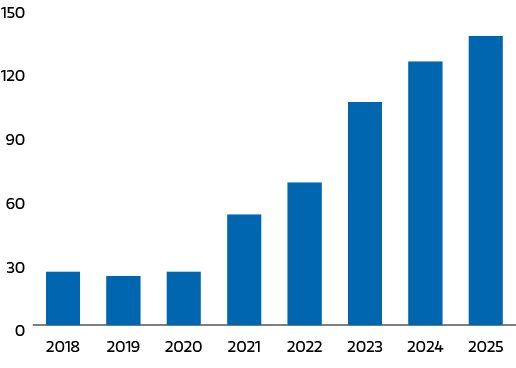
EXHIBIT 8
insight_active-us-manufacturing-requirements_e8.jpg

Source: JLL

3. Multipolar World: Advanced manufacturing now represents 19% of U.S. industrial tenant requirements, according to JLL. Total square footage of active requirements spiked by >40% CAGR since 2020, and leasing activity is led by Texas, Georgia, Arizona and Ohio.9 Reshoring of advanced manufacturing and the related logistics needs, as well as higher defense spending fueled the growth. Put simply, U.S. manufacturing requirements accelerated while personal consumption (one driver of traditional logistics) normalized. Of note, more than 50% of U.S. manufacturing stock is between 30-60 years old which is driving demand for modern product.10 Data center-related product manufacturing and other high value-added sectors account for the vast majority of leasing activity. Defense is also among the sectors leading the market recovery particularly in the coastal markets and led by premier infill pockets in Southern California, Virginia and New England. Defense tenants are benefiting from accelerating governmental spending and the ongoing conflict in the Middle East. In Greater LA, Aerospace & Defense-related leasing activity in the first half of 2026 was 30% more than full year 2025 and >140% more than full year 2024, according to CBRE. Importantly, Defense users are location-sensitive and their real estate decisions are underpinned by proximity to top engineering talent and need for highly secured environments.

Conclusion

The U.S. industrial operating environment appears to be transitioning away from cyclical recovery to its next growth cycle. Demand growth is reaccelerating, development activity is disciplined and vacancy is normalizing. Most importantly, the drivers of future demand are increasingly structural in nature rather than shaped by cyclical drivers, such as GDP or retail sales. The buildout of the AI ecosystem, adoption of next-generation warehouse automation by occupiers, and ongoing reshoring of manufacturing is creating durable sources of absorption which extends well beyond traditional logistics demand. While market performance will remain uneven by geography and asset type, industrial real estate is increasingly benefiting from these long-duration themes. However, the bifurcated environment with assets and locations linked to the super-cycle requires a selective ‘stock picking’ investment approach.


1 Morgan Stanley MSRSTATD Index
2 CBRE, MSREI Strategy calculations of Top 60 markets
3 CBRE, MSREI Strategy calculations of Top 60 markets
4 MSREI Strategy calculations of Class A likekind lease comps
5 Stream Realty, MSREI Strategy
6 KBC
7 KBC
8 Morgan Stanley Research, MSREI Strategy
9 JLL
10 JLL


IMPORTANT DISCLAIMERS

The document has been prepared solely for information purposes and does not constitute an offer or a recommendation to buy or sell any particular security or to adopt any specific investment strategy. The material contained herein has not been based on a consideration of any individual client circumstances and is not investment advice, nor should it be construed in any way as tax, accounting, legal or regulatory advice. To that end, investors should seek independent legal and financial advice, including advice as to tax consequences, before making any investment decision. The information contained herein refers to research but does not constitute an equity research report and is not from Morgan Stanley Equity Research.

Unless otherwise indicated, the views expressed are those of the research and strategy team of Morgan Stanley Real Assets and may differ from those of Morgan Stanley Equity Research and other Morgan Stanley affiliates (including others within Morgan Stanley Real Assets). These views may also differ from investment strategies implemented by Morgan Stanley Real Assets now or in the future. The information (including facts, opinions, estimates or projections) contained herein is based on financial, economic, market and other conditions prevailing as of the date hereof. As such, it remains subject to change at any time. By providing such information, Morgan Stanley Real Assets assumes no obligation to provide any update or supplement to such information following the date hereof. Although reasonable care has been taken to ensure that the information (including facts, opinions, estimates or projections) contained herein is accurate, complete and fair, no warranty, express or implied, is made as to the accuracy, completeness or fairness of such information. Certain economic and market information contained herein may have been obtained from third parties’ sources. While Morgan Stanley Real Assets believes that such sources are reliable, neither Morgan Stanley Real Assets nor any other Morgan Stanley affiliate has independently verified such information or assumes any responsibility or liability for the accuracy, completeness or fairness of such information or any omission of information.

There is no guarantee that any investment strategy will work under all market conditions, and each investor should evaluate their ability to invest for the long-term, especially during periods of downturn in the market. There are important differences in how the strategy is carried out in each of the investment vehicles. Your financial professional will be happy to discuss with you the vehicle most appropriate for you given your investment objectives, risk tolerance and investment time horizon.

The information contained herein is highly confidential. By accepting this document, you agree that this document (including any data, analysis, conclusions, or other information contained herein and all oral information, if any, provided by Morgan Stanley Real Assets in connection herewith) may not be photocopied, reproduced or otherwise shared or distributed to any other persons, in whole or in part, without the prior consent of Morgan Stanley Real Assets. Notwithstanding the foregoing, this document and information may be provided to (a) your legal, tax, financial and other advisors who agree to maintain this document in confidence and (b) a government official to the extent necessary to comply with a judicial or governmental order.

Except as otherwise indicated herein, the views and opinions expressed herein are those of Morgan Stanley Real Assets, are based on matters as they exist as of the date of preparation and not as of any future date and will not be updated or otherwise revised to reflect information that subsequently becomes available or circumstances existing, or changes occurring, after the date hereof.

Historical information is not indicative of future results, and the historical information in this Presentation should not be viewed as an indicator of any future performance that may be achieved as a result of implementing an investment strategy substantially identical or similar to that described in this Presentation.

Certain information contained in this Presentation constitutes

“ forward looking statements,” which can be identified by the use of forward-looking terminology such as “may,” “will,” “should,” “expect,” “anticipate,” “target,” “estimate,” “intend,” “continue,” or “believe,” or the negatives thereof or other variations thereon or comparable terminology. Due to various risks and uncertainties, actual events or results or the actual performance may differ materially from those reflected or contemplated in such forward looking statements.

Prospective investors should pay close attention to the assumptions underlying the analyses and forecasts contained in this Presentation. The analyses and forecasts contained in this Presentation are based on assumptions believed to be reasonable in light of the information presently available. Such assumptions (and the resulting analyses and forecasts) may require modification as additional information becomes available and as economic and market developments warrant. Any such modification could be either favorable or adverse. Nothing contained in this Presentation may be relied upon as a guarantee, promise, assurance or a representation as to the future.

Any index referred to herein is the intellectual property (including registered trademarks) of the applicable licensor. Any product based on an index is in no way sponsored, endorsed, sold or promoted by the applicable licensor and it shall not have any liability with respect thereto.

Real estate investments are subject to special risks, including interest rate and property value fluctuations, as well as risks related to general and economic conditions.

Morgan Stanley, its affiliates and Morgan Stanley Financial Advisors do not provide tax, accounting or legal advice. Individuals should consult their tax advisor for matters involving taxation and tax planning and their attorney for matters involving legal matters.

Morgan Stanley is not responsible for the information contained on any third party website or your use or inability to use such site, nor do we guarantee its accuracy or completeness. The terms, conditions, and privacy policy on any third party website may be different from those applicable to your use of any Morgan Stanley website. The opinions expressed by the author of an article written by a third party are solely his/her own and do not necessarily reflect those of Morgan Stanley. The information and data provided by any third-party website of publication is as of the date of the material when it was written and is subject to change without notice.

DISTRIBUTION

This communication is only intended for and will only be distributed to persons resident in jurisdictions where such distribution or availability would not be contrary to local laws or regulations.

EMEA: This communication was issued and approved in the United Kingdom by Morgan Stanley Investment Management Limited, 25 Cabot Square, Canary Wharf, London E14 4QA, authorized and regulated by the Financial Conduct Authority, for distribution to Professional Clients only and must not be relied upon or acted upon by Retail Clients (each as defined in the UK Financial Conduct Authority’s rules).

Financial intermediaries are required to satisfy themselves that the information in this document is suitable for any person to whom they provide this document in view of that person’s circumstances and purpose. Morgan Stanley Investment Management shall not be liable for, and accepts no liability for, the use or misuse of this document by any such financial intermediary. If such a person considers an investment, she/he should always ensure that she/he has satisfied herself/himself that she/he has been properly advised by that financial intermediary about the suitability of an investment.

This material is for Professional Clients/Accredited Investors only.

In the EU, MSIM and Eaton Vance materials are issued by MSIM Fund Management (Ireland) Limited (“FMIL”). FMIL is regulated by the Central Bank of Ireland and is incorporated in Ireland as a private company limited by shares with company registration number 616661 and has its registered address at 24-26 City Quay, Dublin 2, DO2 NY19, Ireland.

Outside the EU, MSIM materials are issued by Morgan Stanley Investment Management Limited (MSIM Ltd) is authorised and regulated by the Financial Conduct Authority. Registered in England. Registered No. 1981121. Registered Office: 25 Cabot Square, Canary Wharf, London E14 4QA.

In Switzerland, MSIM materials are issued by Morgan Stanley & Co. International plc, London (Zurich Branch) Authorised and regulated by the Eidgenössische Finanzmarktaufsicht (“FINMA”). Registered Office: Beethovenstrasse 33, 8002 Zurich, Switzerland.

Outside the US and EU, Eaton Vance materials are issued by Eaton Vance Management (International) Limited (“EVMI”) 125 Old Broad Street, London, EC2N 1AR, UK, which is authorised and regulated in the United Kingdom by the Financial Conduct Authority. Italy: MSIM FMIL (Milan Branch), (Sede Secondaria di Milano) Palazzo Serbelloni Corso Venezia, 16 20121 Milano, Italy. The Netherlands: MSIM FMIL (Amsterdam Branch), Rembrandt Tower, 11th Floor Amstelplein 11096HA, Netherlands. France: MSIM FMIL (Paris Branch), 61 rue de Monceau 75008 Paris, France. Spain: MSIM FMIL (Madrid Branch), Calle Serrano 55, 28006, Madrid, Spain.

MIDDLE EAST

Dubai: MSIM Ltd (Representative Office, Unit Precinct 3-7th Floor-Unit 701 and 702, Level 7, Gate Precinct Building 3, Dubai International Financial

Centre, Dubai, 506501, United Arab Emirates. Telephone: +97 (0)14 709 7158). In addition, real estate investments are subject to a variety of risks, including those related to, among other things, the economic climate, both nationally and locally, the financial condition of tenants and environmental regulations. Saudi Arabia. This document is not and does not purport to be any of the following: (a) a marketing communication, (b) a securities advertisement, (c) a financial promotion. Material contained herein has not been based on a consideration of any individual client circumstances and is not investment advice, nor should it be construed in any way as tax, accounting, legal or regulatory advice. To that end, recipients or viewers of this document should seek independent legal and financial advice, including advice as to tax consequences, before making any investment decision. This document may not be distributed in the Kingdom of Saudi Arabia except to such persons as are permitted under the Rules of Offering Securities and Continuing Obligations and the Securities Business Regulations issued by the Capital Market Authority. The disclosure of this presentation is restricted to sophisticated investors.

The Capital Market Authority does not make any representation as to the accuracy or completeness of this document and expressly disclaims any liability whatsoever for any loss arising from, or incurred in reliance upon, any part of this document. Prospective purchasers should conduct their own due diligence on the accuracy of the information in this presentation. If you do not understand the contents of this document, you should consult an authorized financial adviser.

Hong Kong: This material is disseminated by Morgan Stanley Asia Limited for use in Hong Kong and shall only be made available to “professional investors” as defined under the Securities and Futures Ordinance of Hong Kong (Cap571). The contents of this material have not been reviewed nor approved by any regulatory authority including the Securities and Futures Commission in Hong Kong. Accordingly, save where an exemption is available under the relevant law, this material shall not be issued, circulated, distributed, directed at, or made available to, the public in Hong Kong. Singapore: This materialis disseminated by Morgan Stanley Investment Management Company and should not be considered to be the subject of an invitation for subscription or purchase, whether directly or indirectly, to the public or any member of the public in Singapore other than (i) to an institutional investor under section 304 of the Securities and Futures Act, Chapter 289 of Singapore (“SFA”); (ii) to a “relevant person” (which includes an accredited investor) pursuant to section 305 of the SFA, and such distribution is in accordance with the conditions specified in section 305 of the SFA; or (iii) otherwise pursuant to, and in accordance with the conditions of, any other applicable provision of the SFA. This publication has not been reviewed by the Monetary Authority of Singapore. Australia: This material is disseminated in Australia by Morgan Stanley Investment Management (Australia) Pty Limited ACN: 122040037, AFSL No. 314182, which accept responsibility for its contents. This publication, and any access to it, is intended only for “wholesale clients” within the meaning of the Australian Corporations Act. Calvert Research and Management, ARBN 635 157 434 is regulated by the U.S. Securities and Exchange Commission under U.S. laws which differ from Australian laws. Calvert Research and Management is exempt from the requirement to hold an Australian financial services licence in accordance with class order 03/1100 in respect of the provision of financial services to wholesale clients in Australia.