


Biodiversity is becoming increasingly relevant to governments and their ability to manage their credit profile as more than half of global GDP – approximately $58 trillion - is moderately or highly dependent on natural capital. Its degradation can erode economic stability, disrupt value chains and weaken long-term growth.
Calvert developed a proprietary Biodiversity indicator that evaluates sovereigns across financially material biodiversity themes, given the inherent complexity of evaluating biodiversity risk.
Natural capital as a sovereign credit risk
More than half of global GDP—approximately $58 trillion —is moderately or highly dependent on natural capital,1 and the World Economic Forum ranks nature loss among the most significant risks to economies over the next decade.2
Nature degradation can erode economic stability, disrupt value chains and weaken long-term growth.3 As data availability improves, empirical evidence increasingly links biodiversity loss to sovereign credit downgrades, suggesting countries that effectively manage their natural resources may achieve stronger credit outcomes.4
Accordingly, biodiversity is becoming a core sovereign credit risk factor for fixed income investors assessing a government’s ability to meet its debt obligations.
Evaluating biodiversity risk is challenging, because of its inherent complexity, which may be why it has been historically underappreciated in financial markets. Key obstacles include:
- Localized and heterogeneous impacts: Biodiversity loss is inherently local. Its effects vary across ecosystems (marine, freshwater and terrestrial) and are shaped by local environmental, economic and social conditions. For example, deforestation is far less financially material for countries that are largely desert.
- Data constraints: Unlike climate risk—often assessed through standardized greenhouse gas emissions—there is no single, universally accepted metric for biodiversity loss. This limits the availability and comparability of high-quality, third-party data and makes it harder to capture both a sovereign’s dependencies on nature and its exposure to nature-related risks and opportunities.
- Indirect channels and long-term effects: Biodiversity loss often affects economies through indirect or second-order channels—via sectors and communities tied to a specific ecosystem. This loss often emerges over longer time horizons. For example, declines in pollinators (species loss) can gradually reduce crop yields, pushing up food prices, increasing subsidy pressures, and weakening rural incomes. Yet, these impacts are often hard to capture in near-term fiscal metrics and traditional sovereign credit analysis.5
Calvert’s proprietary Biodiversity indicator
Recognizing the need to better capture biodiversity risk in sovereign credit analysis, Calvert developed a proprietary Biodiversity indicator to evaluate sovereigns across financially material themes. By grouping countries by income level and landlocked status (Display 1 shows a sample below), the framework can be applied systematically while still reflecting meaningful regional differences.
Sample of Biodiversity Themes by Income⁶ and Landlocked Status⁷
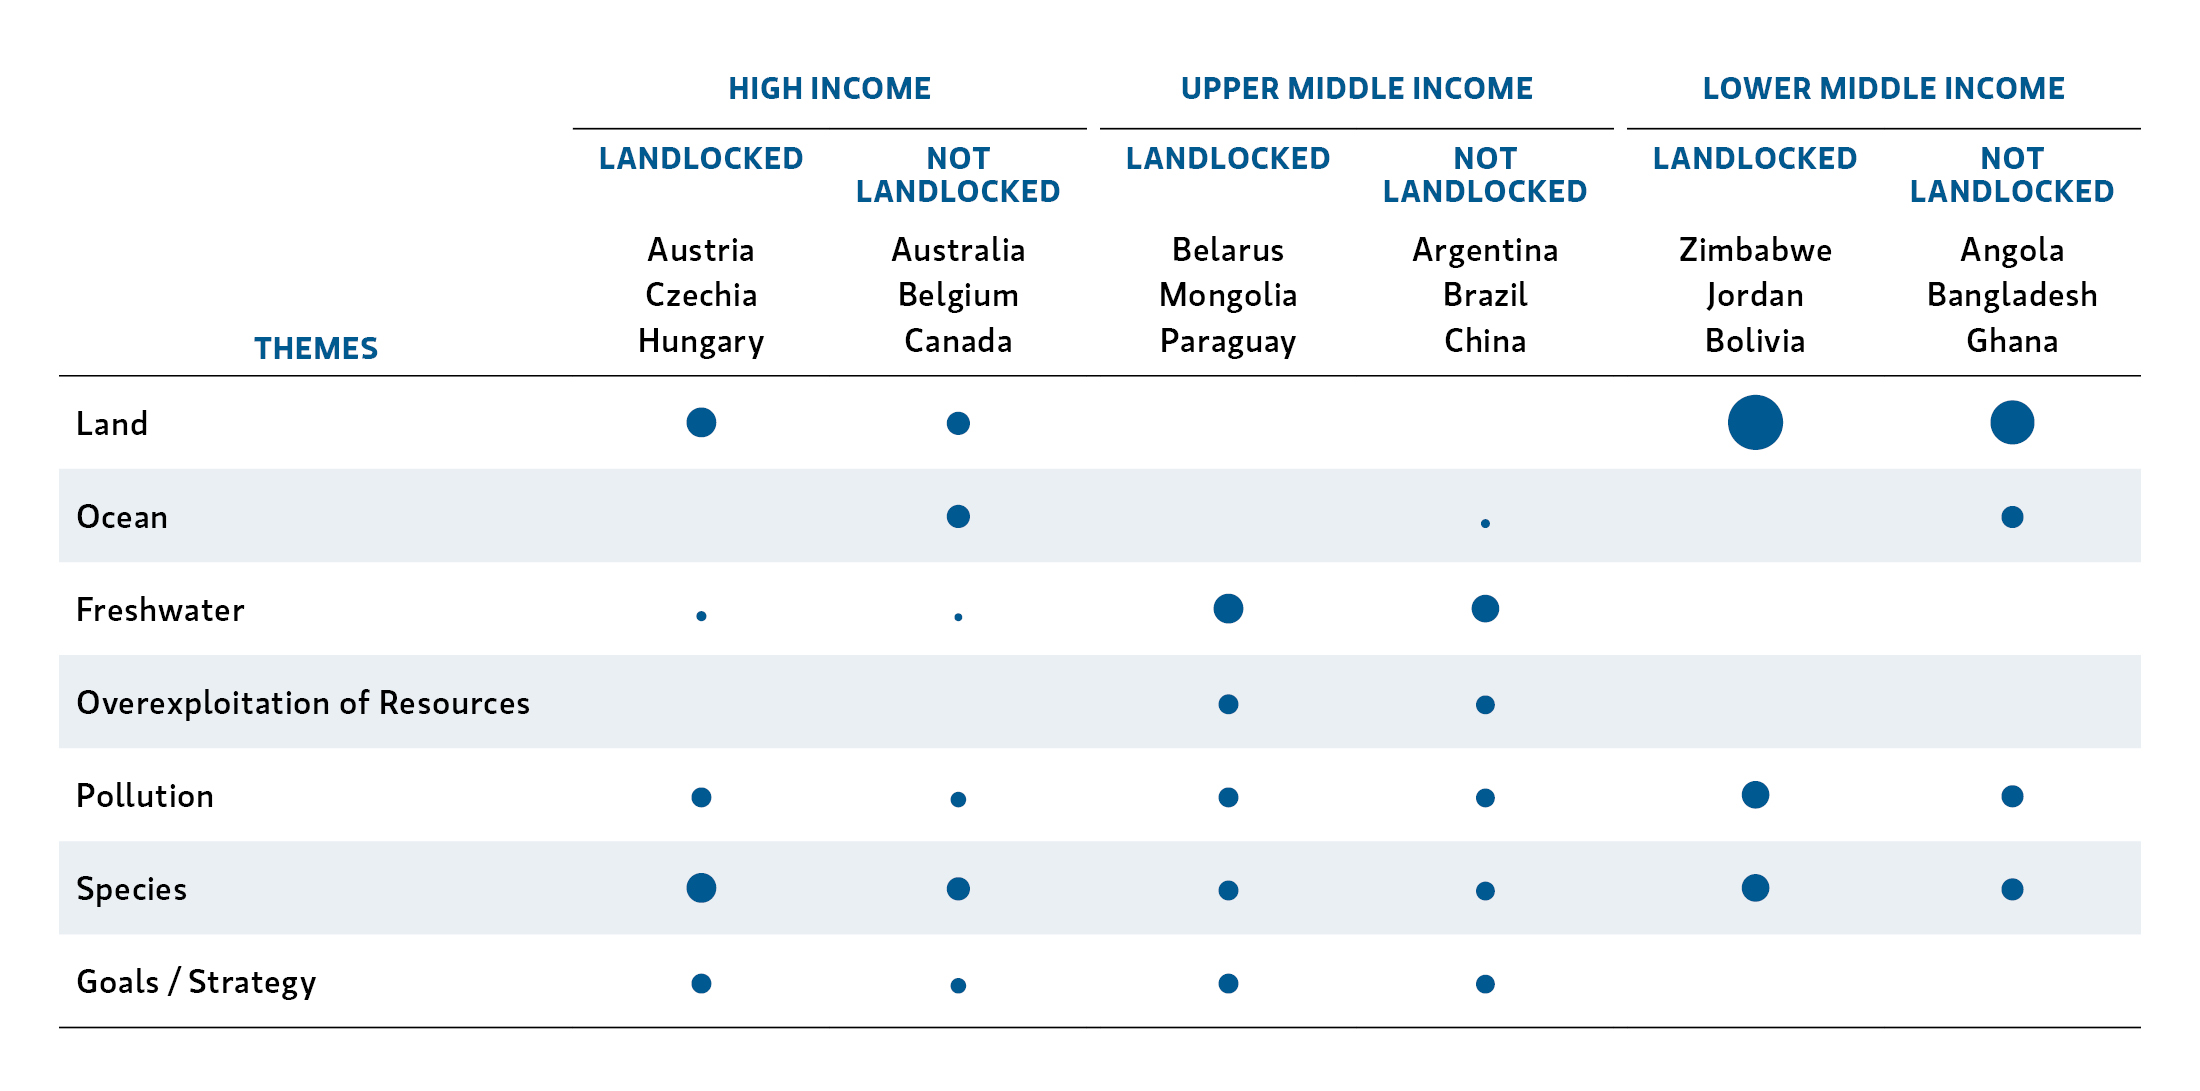
Legend: Dots indicate themes considered financially material for each country group. For illustrative purposes only
Sample of Biodiversity Themes by Income⁶ and Landlocked Status⁷
Our framework comprises seven themes—land, ocean, freshwater, overexploitation of resources, pollution, species and goals/strategy.
The first six are based on the Intergovernmental Science-Policy Platform on Biodiversity and Ecosystem Services (IPBES) Assessment Report, a widely recognized authority on the drivers of biodiversity loss. The seventh theme reflects commitments under the Kunming-Montreal Global Biodiversity Framework (GBF)8 allowing for a broader assessment of biodiversity risk.
To construct our Biodiversity indicator and define the themes, we used the 23 targets of the Kunming-Montreal GBF to guide our selection of 115 key performance indicators (KPIs) from publicly available data. These KPIs were organized under the six core themes derived from IPBES to help identify the primary drivers of biodiversity decline. We created the seventh theme on national goals and strategy to provide a broader context for evaluating sovereigns.
Finally, we back-tested the relationship between these KPIs and sovereign bond performance to determine their financial materiality. Themes with stronger links to performance received higher weightings, improving the indicator’s relevance for credit analysis.
The framework then generates a single composite country score, where higher values reflect stronger biodiversity performance. Because theme weights differ by income level and landlocked-status, countries are grouped to ensure like-for-like comparisons, consistent with our proprietary Sovereign Fixed Income ESG Methodology. The framework can also be applied across the full global universe for cross-country benchmarking, irrespective of income level or landlocked status. This multidimensional approach delivers a rigorous assessment while preserving the standardization needed for systematic, cross-country application.
The new framework can be deployed across the organization to support a range of investment and research needs. Beyond portfolio integration, the insights from this framework can strengthen our engagement efforts, helping us pinpoint priority themes and issuers where targeted dialogue can drive the greatest impact.
We believe Calvert’s proprietary Biodiversity indicator provides a robust assessment of biodiversity risk for sovereign bond analysis. It helps capture the multifaceted nature of ecosystem dependencies and vulnerabilities, while retaining comparability across countries with different biodiversity profiles. This approach aims to strengthen our assessment of long-term risks and opportunities, supporting more resilient investment decisions. Most importantly it is a way to capture the growing evidence that biodiversity loss can lead to material economic impact. Looking ahead, the research underpinning this framework will be leveraged to evaluate corporate biodiversity performance — our next focus on the biodiversity front.
1 PWC, “PwC boosts global nature and biodiversity capabilities,’ April 29, 2023.
2 World Economic Forum, The Global Risks Report, 2025.“
3 University of Cambridge, “Loss of nature is pushing nations toward credit downgrades and 'bankruptcy',” 2022.
4 AFII, “Biodiversity risks in government bond portfolios,” July 24, 2025.
5 European Central Bank Economic Bulletin, “Economic and financial impacts of nature degradation and biodiversity loss,” June 2024.
6 Income groups are defined using the World Bank’s income thresholds, which are updated annually.
7 World Bank as of July 2025 (most recent data), and Calvert Research and Management.
8 The Kunming-Montreal Global Biodiversity Framework (GFB), adopted in December 2022, has 23 action-oriented targets designed to halt and reverse biodiversity loss globally, to be met by 2030.
Featured Insights


Risk Considerations
There is no assurance that a Portfolio will achieve its investment objective.
Portfolios are subject to market risk, which is the possibility that the market values of securities owned by the Portfolio will decline and that the value of Portfolio shares may therefore be less than what you paid for them. Market values can change daily due to economic and other events (e.g. natural disasters, health crises, terrorism, conflicts and social unrest) that affect markets, countries, companies or governments. It is difficult to predict the timing, duration, and potential adverse effects (e.g. portfolio liquidity) of events. Investments in foreign markets entail special risks such as currency, political, economic, and market risks. ESG Strategies that incorporate impact investing and/or Environmental, Social and Governance (ESG) factors could result in relative investment performance deviating from other strategies or broad market benchmarks, depending on whether such sectors or investments are in or out of favor in the market. As a result, there is no assurance ESG strategies could result in more favorable investment performance.
The views and opinions are those of the author as of the date of publication and are subject to change at any time due to market or economic conditions and may not necessarily come to pass. The views expressed do not reflect the opinions of all investment personnel at Morgan Stanley Investment Management (MSIM) and its subsidiaries and affiliates (collectively the Firm”), and may not be reflected in all the strategies and products that the Firm offers. This material is a general communication, which is not impartial, is for informational and educational purposes only, not a recommendation to purchase or sell specific securities, or to adopt any particular investment strategy. Information does not address financial objectives, situation or specific needs of individual investors. Charts and graphs provided are for illustrative purposes only. Past Performance is no guarantee of future results.