

 Top

European risk premia have risen as concerns over France’s fiscal trajectory have triggered selling pressure and a broader repricing of European assets, particularly government bonds. The yield on 10-year French government debt has reached its highest level since 2002, while the 10-year France (OAT) – Germany (Bund) spread widened from 80 basis points (bps) at the start of the third quarter of 2026 to 160 bps in early October, the widest level since the euro-area sovereign debt crisis in 2011. Volatility has also spread to the government bond markets of other highly indebted countries, including Italy and Greece. Euro investment grade credit spreads have widened in parallel, but the asset class has remained comparatively resilient, reflecting the market’s recognition of corporate issuers’ financial discipline and robust balance sheets. This distinction is increasingly visible in valuations: a record number of French corporate bonds now yield less than French government bonds of comparable maturity.
Market Update
The conflict in the Middle East has kept energy prices elevated and inflationary pressures persistent across the euro area, prompting the European Central Bank (ECB) to raise the deposit rate to 2.5% and maintain a hawkish bias. AI and data center-linked demand continue to support global economic growth. At the same time, Germany’s fiscal expansion is beginning to support growth but is also driving a significant increase in sovereign bond issuance, placing upward pressure on government bond yields. Fiscal concerns in France have weighed not only on French government bonds but also on the broader universe of highly indebted European sovereigns, including Italy and Greece. The resulting increase in risk premiums has driven a meaningful repricing of sovereign debt markets and contributed to higher borrowing costs across the region.
French Fiscal Concerns
France remains at the centre of investors’ concerns. The minority government faces the difficult task of passing a budget that its fiscal watchdog has described as the minimum credible response to the country’s deteriorating public finances, through a parliament that has already brought down two prime ministers over fiscal tightening measures. Even if approved in its current form, the budget would deliver only modest deficit reduction (from 5.4% of GDP this year to 5.0% in 2027) while debt (122% of GDP) and interest costs continue to rise. At the same time, France faces a substantial financing requirement, requiring record levels of sovereign bond issuance. Credit rating reviews in the coming months add a further layer of uncertainty. Beyond the near-term fiscal debate, investors must also contend with an increasingly uncertain political backdrop ahead of next year’s presidential election, where recent polling points to growing support for the National Rally and its leader, Marine Le Pen. Cost of living protests have degenerated into looting and burning across France and the government cannot simply spend more to appease the public due to a debt mountain and a budget deficit. As a result, fiscal and political risks remain closely intertwined, underpinning a persistent risk premium in French government bonds. The OAT-Bund spread has widened 54bps since the start of the year.
European Investment Grade Credit
European investment grade credit has told a markedly different story. While sovereign spreads have widened meaningfully amid rising fiscal and political concerns, corporate spreads have remained comparatively resilient. The option-adjusted spread (OAS) on the Bloomberg European Aggregate Corporate Index stood at 94 bps on 14 October, only modestly wider than at the start of the year. Over the past twelve months, realised volatility in French and Italian government bonds has been roughly three times higher than that of European investment grade credit spreads (Display 1).
More broadly, the relationship between corporate and sovereign risk has undergone a notable reversal over the past five years (Display 2). In 2022, corporate credit carried most of the perceived risk, with investment grade spreads widening sharply (peaking at 234bps) while sovereign risk premiums remained subdued (the OAT-Bund spread was as tight as 37bps in 2022). Since then, European credit fundamentals have strengthened, issuance has been relatively contained and spreads have retraced substantially (as tight as 72bps in February 2026), while concerns surrounding government finances and issuance needs have pushed sovereign risk premiums materially higher. Volatility has followed a similar pattern. Whereas investment grade credit spreads were significantly more volatile than French sovereign spreads in 2022, sovereign risk has become the dominant source of volatility in 2026. The result is an unusual market backdrop in which high-quality corporate credit has exhibited greater stability than parts of the euro-area government bond market.
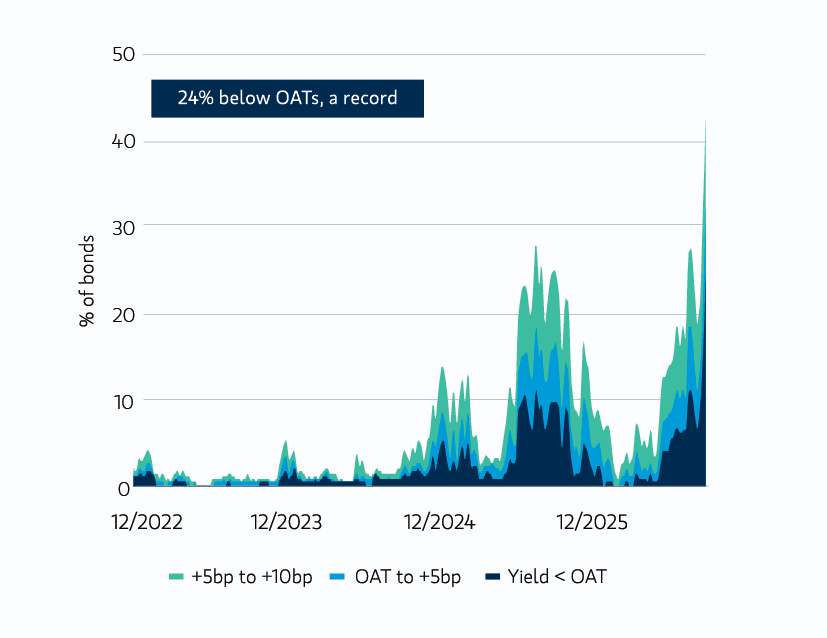
A record number of French corporate bonds now yield less than French government bonds of comparable maturity (Display 3).
DISPLAY 1
Sovereign volatility has surged, while corporate credit volatility remains low
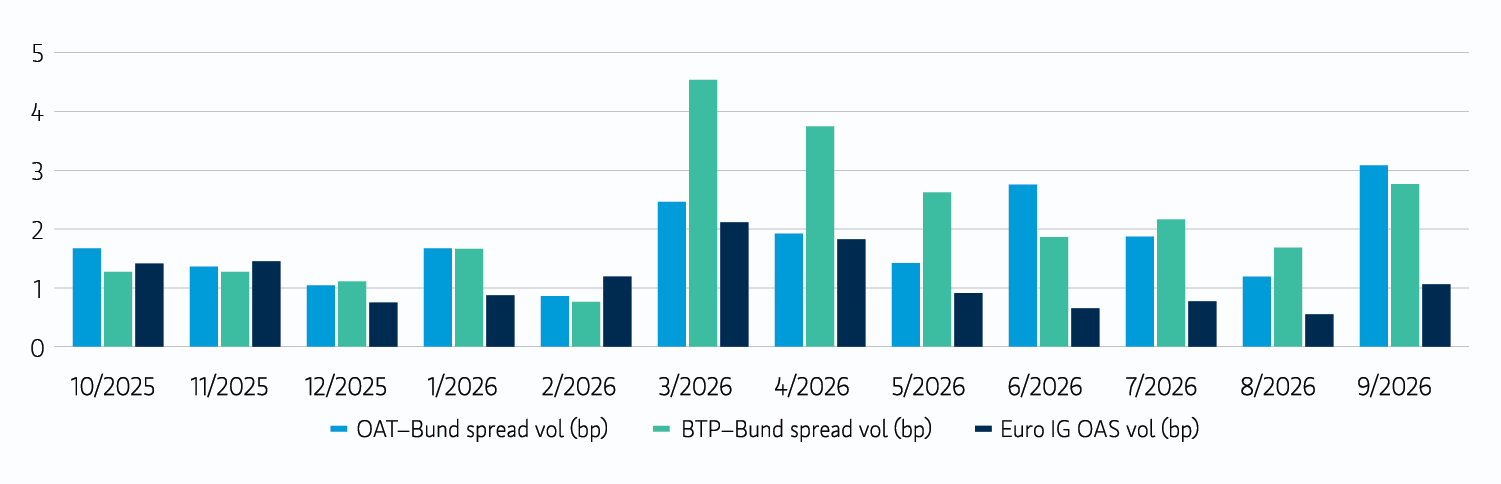
Source: Bloomberg, as of 6 October 2026. Euro IG OAS is the Bloomberg Euro Aggregate Corporate index option-adjusted spread. Monthly volatility = standard deviation of daily changes within each calendar month, in bps. Trailing-12-month average (October 2025–September 2026): 10Y OAT ≈ 4.0x, 10Y BTP ≈ 4.3x and 10Y Bund ≈ 3.0x euro IG spread volatility. Past performance is no guarantee of future results. The index performance is provided for illustrative purposes only and is not meant to depict the performance of a specific investment.
DISPLAY 1
Sovereign volatility has surged, while corporate credit volatility remains low
Sovereign volatility has exceeded credit volatility every month over the past 12 months
DISPLAY 2
Sovereign vs. corporate risk premia
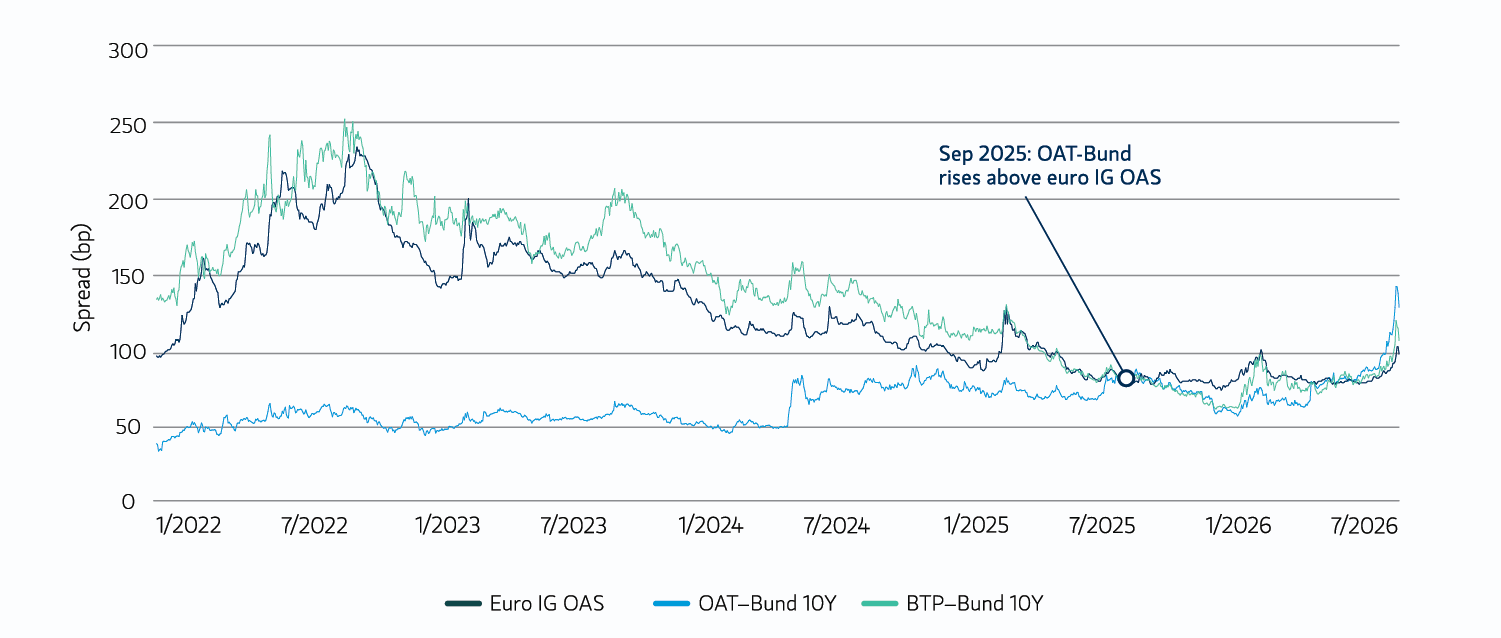
Source: Bloomberg, 3 January 2022–6 October 2026. Sovereign spreads are 10-year yield differentials to the German Bund. The euro IG index has a shorter duration than 10-year benchmarks, so the level comparison is illustrative. Past performance is no guarantee of future results. The index performance is provided for illustrative purposes only and is not meant to depict the performance of a specific investment.
DISPLAY 2
Sovereign vs. corporate risk premia
Strong reversal YTD The OAT–Bund spread now exceeds the spread of the Euro IG index
DISPLAY 3
French corporates vs. OATs
DISPLAY 3
French corporates vs. OATs
A record 24% of French corporate bonds yield less than equivalent maturity French government bonds, led by sectors with international revenue
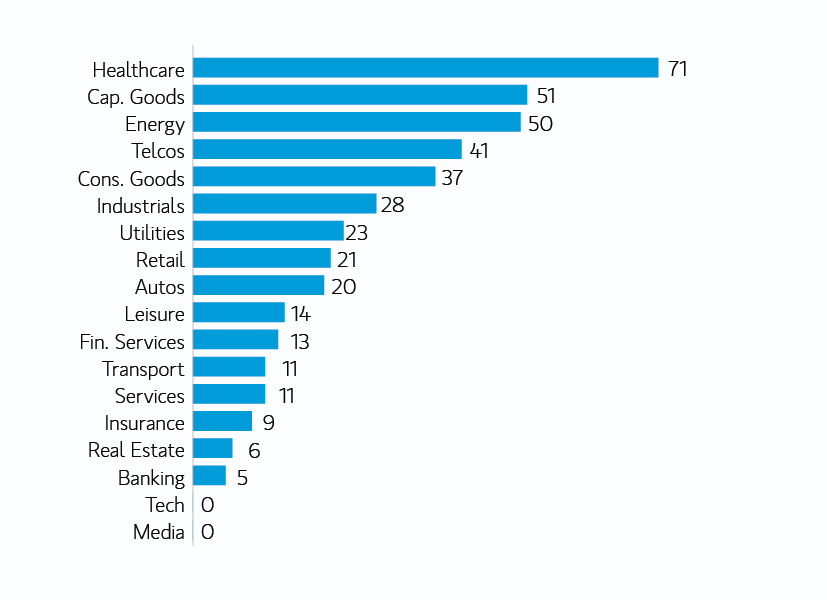
Source: Bank of America, Morgan Stanley Investment Management as of 1 October 2026. Past performance is no guarantee of future results.
Are Corporate Balance Sheets Safer Than Sovereign Balance Sheets?
We believe there are good fundamental reasons why European investment grade corporates have remained relatively resilient despite greater volatility in sovereign bond markets.
European investment grade corporate fundamentals remain broadly sound. Leverage has risen modestly but remains around the middle of its longer-term historical range, while interest coverage has remained relatively stable. Corporates entered this period with generally healthy balance sheets, supported by continued financial discipline from management teams. This is particularly evident relative to the US, where the credit cycle appears more advanced. European companies have generally pursued more conservative balance-sheet strategies, with less debt-funded M&A, fewer large-scale share buybacks and less pressure to increase leverage in support of shareholder returns. This matters because it reduces the risk that corporate balance sheets deteriorate at precisely the point when borrowing costs remain elevated. While higher financing costs and softer economic growth could create pressure for some issuers, we do not see evidence of a broad deterioration in corporate credit quality.
The Q2 corporate earnings season was one of the strongest in several years on both sides of the Atlantic. Corporate profitability proved far more resilient than expected despite geopolitical tensions and higher energy prices. Energy, Financials, Technology, and Industrials were the key drivers, while consumer sectors remained more mixed. 90%+ of companies beat consensus earnings expectations. Key themes:
- AI and data center-linked demand continue to support growth across technology (semis/memory/hardware), utilities, industrials, and energy while simultaneously increasing disruption risk across software and services.
- The Middle East conflict is adding to global cost pressures, though impacts remain manageable given hedging and pricing actions, with FY26 guidance reiterated across many sectors.
- Consumer sentiment remains subdued, exacerbated by inflation concerns, leading companies to prioritize brand strength, premiumization, and M&A to defend margins and share prices.
- Globally, banks delivered solid results on stronger core revenues, with net interest income improving in the US and bottoming out across most European jurisdictions, alongside strong capital markets and wealth contributions. Insurance earnings were in line to slightly ahead. Private credit remained an overhang, with flows moderating into select strategies, while European managers benefited from reduced exposure to the asset class.
In Europe, idiosyncratic risks have increased, particularly in sectors such as autos, but these pressures have so far remained relatively concentrated rather than developing into a broader problem for European investment grade corporates.
The direction of travel for European sovereigns looks quite different. Governments face growing structural spending demands at a time when debt burdens and financing costs are already elevated. France is the clearest example, with sizeable fiscal deficits and higher interest costs creating persistent pressure on the sovereign balance sheet. Germany starts from a much stronger fiscal position, but its decision to increase borrowing to finance defence and infrastructure nevertheless represents an important shift towards greater sovereign issuance. Italy has made meaningful progress on fiscal discipline and economic reform. Under current plans, Italy will give back some of that progress in 2027 (an election year), with a higher deficit. The country’s high debt to GDP ratio leaves it inherently sensitive to higher interest rates, rising funding costs and general market volatility. More broadly for Europe, defence, infrastructure, demographics and other spending priorities suggest that fiscal deficits are likely to remain higher and government debt is likely to remain substantial.
This creates an unusual divergence: corporate balance sheets remain relatively disciplined while sovereign balance sheets are being asked to absorb significantly greater financing requirements. That distinction helps explain why periods of sovereign weakness have not translated one-for-one into wider corporate credit spreads.
Credit is clearly not immune to sovereign stress. A disorderly sovereign sell-off would ultimately affect corporates through higher risk-free rates, weaker economic activity, tighter financial conditions and deteriorating market sentiment. However, the experience since 2024 suggests that the transmission mechanism is no longer automatic. Absent a genuine sovereign funding or systemic crisis, we believe healthy corporate fundamentals, disciplined balance sheet management and supportive credit technicals should continue to provide Euro IG with a meaningful degree of insulation from sovereign volatility.
Put simply, European sovereign and corporate creditworthiness are increasingly moving in different directions: governments are borrowing more, while many investment grade companies continue to exhibit strong profitability and remain focused on protecting their balance sheets.
Technicals Matter
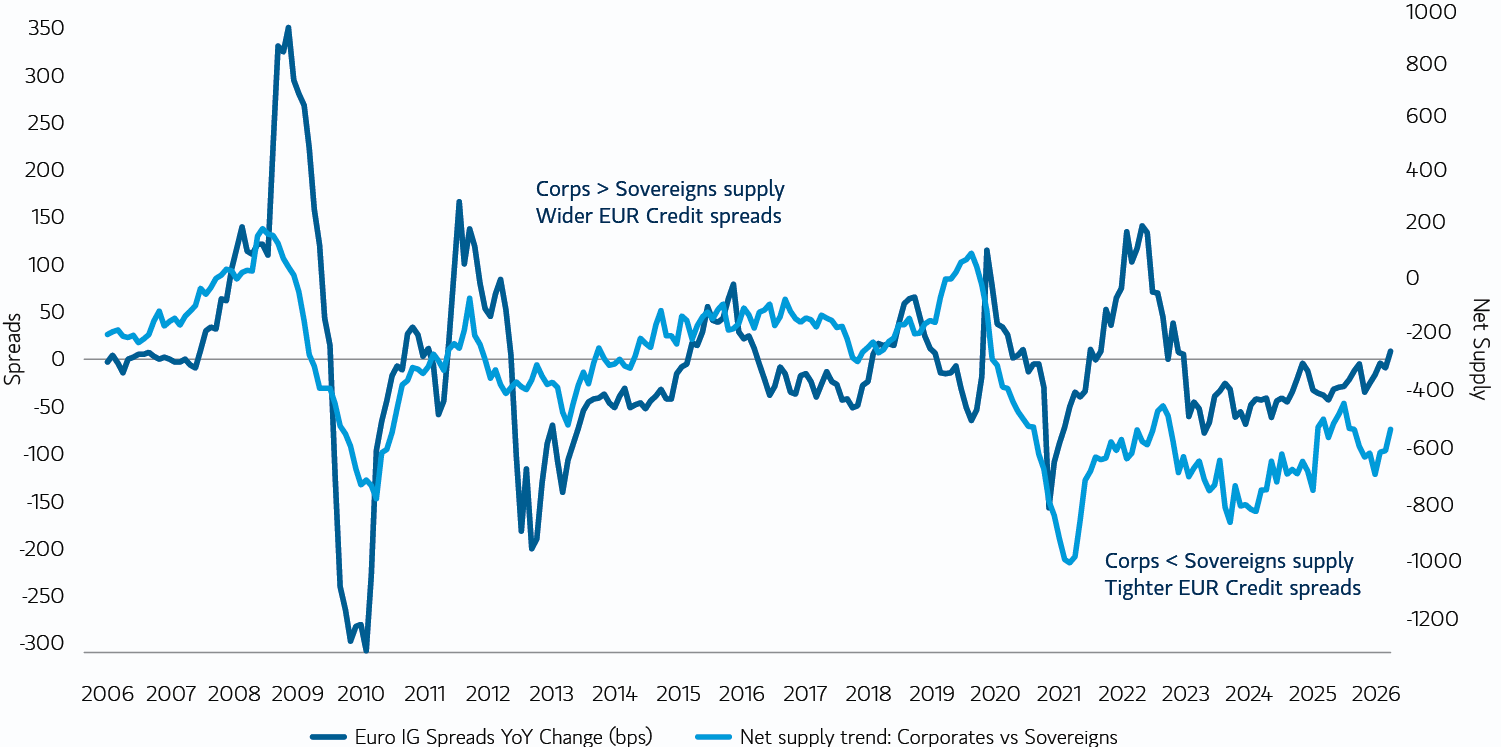
DISPLAY 4
Net Supply vs Spreads
The views and opinions expressed are those of the author as of October 2026 and are subject to change based on market, economic and other conditions.
Data sourced from Bloomberg daily series (euro IG credit OAS, 5/10/30Y Bund yields, 10Y OAT and BTP yields and spreads to Bunds) through 6 October 2026 unless otherwise stated. Past performance is not indicative of future results. For discussion only; not investment advice and does not constitute a recommendation to buy or sell any particular security.
DISPLAY 4
Net Supply vs Spreads
The technical backdrop increasingly favours European investment grade corporate bonds over government debt. Sovereign markets face a structural supply challenge: large fiscal deficits and elevated debt burdens require governments to raise more financing, increasing bond issuance at a time when central banks are no longer absorbing supply through large scale QE programmes. This growing abundance of government debt means sovereigns must compete increasingly hard for investor capital, placing upward pressure on yields and risk premia, particularly further out the curve.
European IG corporates offer a more favourable supply-demand dynamic. Net supply remains relatively manageable, while attractive “all-in” yields continue to generate strong demand for the asset class. This combination of attractive income and relative scarcity provides a powerful technical underpinning for valuations. Strong yields have already helped sustain demand for credit despite historically tight spreads.
Importantly, this demand is increasingly structural rather than purely cyclical. Institutional asset allocation changes should provide an additional source of capital for high-quality investment grade debt, while overseas investors continue to look towards European IG as a means of diversifying global credit portfolios. Fixed maturity and buy and hold strategies provide another important buyer base, particularly for shorter dated corporate bonds.
The contrast is therefore compelling: government bond supply is becoming increasingly abundant, while high-quality corporate bonds remain comparatively scarce and supported by multiple sources of structural demand. In an environment where both are competing for capital, we believe these stronger technicals provide an important relative tailwind for European IG credit.
European Investment Grade Credit: Positioning and Outlook
Cautiously Constructive
Despite ongoing tensions in the Middle East and the France driven rise in European risk premia, we remain cautiously constructive on credit. Positive economic growth (supported by structural investment themes, including AI, energy transition and infrastructure spending), supportive fiscal policy and resilient consumption provide a solid backdrop, while healthy corporate balance sheets and strong profitability should help keep defaults contained. Meanwhile, attractive “all-in” yields, strong investor demand and manageable net supply should continue to provide a favourable technical backdrop for Euro IG credit, helping support valuations at levels tighter than their long-term average. That said, we are becoming more selective as dispersion increases, while higher interest-rate volatility warrants greater caution on duration.
Country risk
France - Selective: global champions over domestic exposure: We favour French issuers with diversified international revenue and conservative balance sheets. We are cautious on issuers whose credit is tied to the French state or the domestic economy, including banks, companies with high government ownership, domestically focused real estate and sectors exposed to changes in government policy.
Italy – Neutral: A beta play: Italian government and corporate debt have historically exhibited a similar beta. More recently, however, sovereign debt has underperformed corporates. Should sovereign volatility persist, we see scope for Italian corporate credit to come under greater pressure. We therefore favour selective exposure to large, regulated utilities and banks, where attractive valuations provide compensation for their closer linkages to the sovereign.
United States - Remain constructive on the US economy and therefore US corporates: Overweights concentrated in a mixture of banks and high quality, longer dated corporate debt. Cautious on hyperscalers.
NON-FINANCIALS (idiosyncratic risk is ON THE RISE)
While corporate fundamentals remain broadly robust, idiosyncratic risks are becoming more pronounced, particularly in the automotive (auto) sector. The sector faces a combination of structural pressures, including elevated costs and further restructuring requirements, intensifying competition from Chinese manufacturers, weaker demand in China and the impact of US tariffs. Volkswagen’s significant guidance downgrade on 18 September highlighted these challenges, citing material pressures from China, tariffs and restructuring costs. Following the announcement, auto spreads widened by around 19bps, underperforming the broader investment grade index by approximately 7bps. Given these persistent structural headwinds and the potential for further negative credit catalysts, we remain defensively positioned towards the sector.
We remain cautious on sectors and issuers exhibiting late cycle, less credit friendly behaviour, including elevated shareholder distributions, rising capital expenditure and opportunistic M&A. Against this backdrop, sector allocation and security selection within industrials and utilities remains paramount.
Financials (CONSTRUCTIVE)
Banks are the most direct transmission channel from sovereign stress into credit, given their holdings of domestic government bonds and sensitivity to funding conditions and the broader domestic economy. Despite this linkage, we believe the recent volatility in European sovereign markets poses limited structural risk to bank fundamentals. The sector continues to benefit from robust profitability, strong capital buffers and healthy asset quality, with limited evidence of a meaningful deterioration in non-performing loans, alongside continued regulatory discipline. Valuations also remain attractive relative to industrials, while comparatively favourable net supply dynamics should provide additional technical support.
Lower quality debt
In a low default environment, we continue to see value in BBB rated and selected subordinated debt (with a short duration focus), where spreads continue to comparatively compensate investors for structural subordination, extension risk, and price volatility.
What we are watching
The near-term risks to our constructive base case for spreads are:
- Geopolitical Escalation: A prolonged or renewed escalation of the US-Iran conflict could drive energy prices higher, reignite inflationary pressures and weaken the macroeconomic outlook, creating a more challenging backdrop for credit.
- Tighter Financial Conditions: Persistent inflation, driven by supply side pressures such as higher energy prices and resilient underlying demand, could lead markets to price, and central banks to deliver, further monetary tightening. Higher yields and borrowing costs would weigh on growth and credit valuations.
- Asset Price Excesses: Elevated valuations and growing excesses across risk assets could increase the risk of a disorderly unwind of leveraged positions and carry trades, resulting in weaker liquidity, greater market volatility and wider credit spreads.
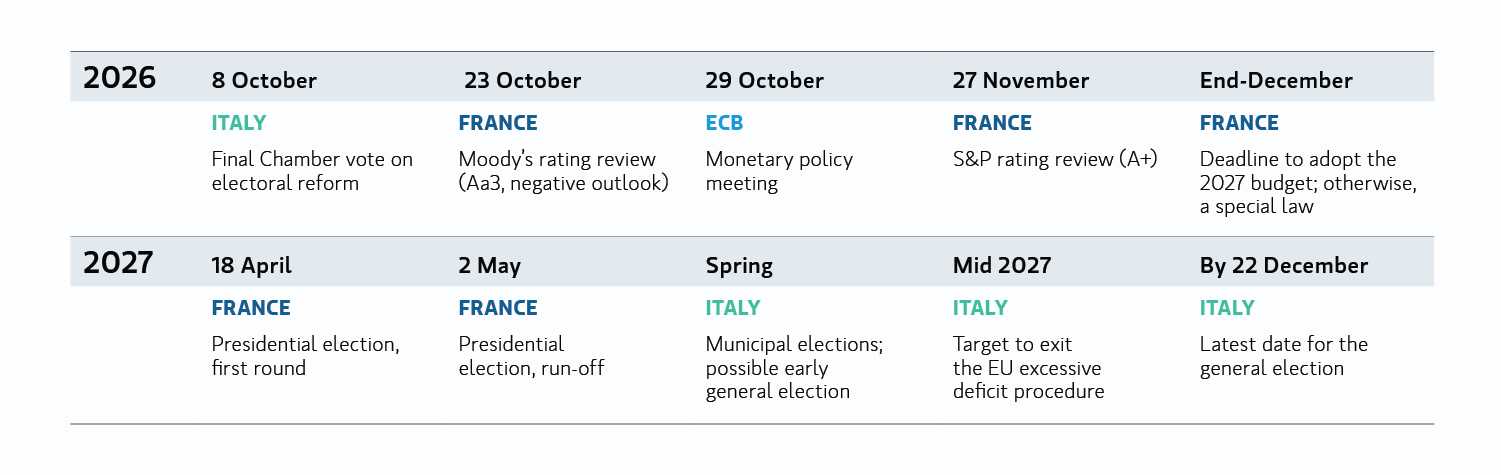
- Euro Sovereign Contagion: A further deterioration in fiscal or political confidence in a major euro area sovereign could spill over into other government bond markets, prompting a broader repricing of European risk assets. A timeline of key dates with respect to European political and fiscal events are shown (Display 5)
DISPLAY 5
The political and fiscal calendar—a dense run of catalysts
Source: European Central Bank, Agence France Trésor, Italian Ministry of Economy and Finance, rating agency calendars, Morgan Stanley Investment Management, as of 6 October 2026. Dates are subject to change.
DISPLAY 5
The political and fiscal calendar—a dense run of catalysts
Key dates for French and Italian sovereign risk over the next 15 months
Featured Insights




RISK CONSIDERATIONS
There is no assurance that any strategy will achieve its investment objective. Portfolios are subject to market risk, which is the possibility that the market values of securities owned by the portfolio will decline and that the value of portfolio shares may therefore be less than what you paid for them. Accordingly, you can lose money investing in a portfolio. Fixed-income securities are subject to the ability of an issuer to make timely principal and interest payments (credit risk), changes in interest rates (interest rate risk), the creditworthiness of the issuer and general market liquidity (market risk). In a rising interest-rate environment, bond prices may fall and may result in periods of volatility and increased portfolio redemptions. In a declining interest-rate environment, the portfolio may generate less income. Longer-term securities may be more sensitive to interest rate changes. Investments in foreign markets entail special risks such as currency, political, economic and market risks. High-yield securities (junk bonds) are lower-rated securities that may have a higher degree of credit and liquidity risk.
Important disclosures
Charts and graphs provided herein are for illustrative purposes only.
Past performance is no guarantee of future results.
There is no guarantee that any investment strategy will work under all market conditions, and each investor should evaluate their ability to invest for the long-term, especially during periods of downturn in the market.
A separately managed account may not be appropriate for all investors. Separate accounts managed according to the particular Strategy may include securities that may not necessarily track the performance of a particular index. Please consider the investment objectives, risks and fees of the Strategy carefully before investing. A minimum asset level is required.
For important information about the investment managers, please refer to Form ADV Part 2.
The views and opinions and/or analysis expressed are those of the author or the investment team as of the date of preparation of this material and are subject to change at any time without notice due to market or economic conditions and may not necessarily come to pass. Furthermore, the views will not be updated or otherwise revised to reflect information that subsequently becomes available or circumstances existing, or changes occurring, after the date of publication. The views expressed do not reflect the opinions of all investment personnel at Morgan Stanley Investment Management (MSIM) and its subsidiaries and affiliates (collectively “the Firm”), and may not be reflected in all the strategies and products that the Firm offers.
Forecasts and/or estimates provided herein are subject to change and may not actually come to pass. Information regarding expected market returns and market outlooks is based on the research, analysis and opinions of the authors or the investment team. These conclusions are speculative in nature, may not come to pass and are not intended to predict the future performance of any specific strategy or product the Firm offers. Future results may differ significantly depending on factors such as changes in securities or financial markets or general economic conditions.
This material has been prepared on the basis of publicly available information, internally developed data and other third-party sources believed to be reliable. However, no assurances are provided regarding the reliability of such information and the Firm has not sought to independently verify information taken from public and third-party sources.
This material is a general communication, which is not impartial and all information provided has been prepared solely for informational and educational purposes and does not constitute an offer or a recommendation to buy or sell any particular security or to adopt any specific investment strategy. The information herein has not been based on a consideration of any individual investor circumstances and is not investment advice, nor should it be construed in any way as tax, accounting, legal or regulatory advice. To that end, investors should seek independent legal and financial advice, including advice as to tax consequences, before making any investment decision.
The indexes are unmanaged and do not include any expenses, fees or sales charges. It is not possible to invest directly in an index. Any index referred to herein is the intellectual property (including registered trademarks) of the applicable licensor. Any product based on an index is in no way sponsored, endorsed, sold or promoted by the applicable licensor and it shall not have any liability with respect thereto.
This material is not a product of Morgan Stanley’s Research Department and should not be regarded as a research material or a recommendation.
The Firm has not authorised financial intermediaries to use and to distribute this material, unless such use and distribution is made in accordance with applicable law and regulation. Additionally, financial intermediaries are required to satisfy themselves that the information in this material is appropriate for any person to whom they provide this material in view of that person’s circumstances and purpose. The Firm shall not be liable for, and accepts no liability for, the use or misuse of this material by any such financial intermediary.
This material may be translated into other languages. Where such a translation is made this English version remains definitive. If there are any discrepancies between the English version and any version of this material in another language, the English version shall prevail.
The whole or any part of this material may not be directly or indirectly reproduced, copied, modified, used to create a derivative work, performed, displayed, published, posted, licensed, framed, distributed or transmitted or any of its contents disclosed to third parties without the Firm’s express written consent. This material may not be linked to unless such hyperlink is for personal and non-commercial use. All information contained herein is proprietary and is protected under copyright and other applicable law.
Eaton Vance is part of Morgan Stanley Investment Management. Morgan Stanley Investment Management is the asset management division of Morgan Stanley.
Distribution
This material is only intended for and will only be distributed to persons resident in jurisdictions where such distribution or availability would not be contrary to local laws or regulations.
MSIM, the asset management division of Morgan Stanley (NYSE: MS), and its affiliates have arrangements in place to market each other’s products and services. Each MSIM affiliate is regulated as appropriate in the jurisdiction it operates. MSIM’s affiliates are: Calvert Research and Management, Eaton Vance Management, Parametric Portfolio Associates LLC, Parametric SAS, and Atlanta Capital Management LLC
This material has been issued by any one or more of the following entities:
EMEA
This material is for Professional Clients/Accredited Investors only.
In the EU, MSIM materials are issued by MSIM Fund Management (Ireland) Limited (“FMIL”). FMIL is regulated by the Central Bank of Ireland and is incorporated in Ireland as a private company limited by shares with company registration number 616661 and has its registered address at 24-26 City Quay, Dublin 2, DO2 NY19, Ireland.
Outside the EU, MSIM materials are issued by Morgan Stanley Investment Management Limited (MSIM Ltd) is authorised and regulated by the Financial Conduct Authority. Registered in England. Registered No. 1981121. Registered Office: 25 Cabot Square, Canary Wharf, London E14 4QA.
In Switzerland, MSIM materials are issued by Morgan Stanley & Co. International plc, London (Zurich Branch) Authorised and regulated by the Eidgenössische Finanzmarktaufsicht ("FINMA"). Registered Office: Beethovenstrasse 33, 8002 Zurich, Switzerland.
Italy: MSIM FMIL (Milan Branch), (Sede Secondaria di Milano) Palazzo Serbelloni Corso Venezia, 16 20121 Milano, Italy. The Netherlands: MSIM FMIL (Amsterdam Branch), Rembrandt Tower, 11th Floor Amstelplein 1 1096HA, Netherlands. France: MSIM FMIL (Paris Branch), 61 rue de Monceau 75008 Paris, France. Spain: MSIM FMIL (Madrid Branch), Calle Serrano 55, 28006, Madrid, Spain. Germany: MSIM FMIL Frankfurt Branch, Große Gallusstraße 18, 60312 Frankfurt am Main, Germany (Gattung: Zweigniederlassung (FDI) gem. § 53b KWG). Denmark: MSIM FMIL (Copenhagen Branch), Gorrissen Federspiel, Axel Towers, Axeltorv2, 1609 Copenhagen V, Denmark.
MIDDLE EAST
Dubai International Financial Centre: This information does not constitute or form part of any offer to issue or sell, any investment products in the UAE (including the Dubai International Financial Centre and the Abu Dhabi Global Market) and accordingly should not be construed as such. The content of this report has not been approved by or filed with the UAE Central Bank, the Dubai Financial Services Authority, the UAE Securities and Commodities Authority or the Financial Services Regulatory Authority.
Abu Dhabi Global Market ("ADGM"): This material is sent strictly within the context of, and constitutes, an Exempt Communication. This material relates to (strategy) which is not subject to any form of regulation or approval by the Financial Services Regulatory Authority of the Abu Dhabi Global Market (the “FSRA”).
Saudi Arabia
This financial promotion was issued and approved for use in Saudi Arabia by Morgan Stanley Saudi Arabia, Al Rashid Tower, Kings Sand Street, Riyadh, Saudi Arabia, authorized and regulated by the Capital Market Authority license number 06044-37.
U.S.
NOT FDIC INSURED | OFFER NO BANK GUARANTEE | MAY LOSE VALUE | NOT INSURED BY ANY FEDERAL GOVERNMENT AGENCY | NOT A DEPOSIT
Latin America (Brazil, Chile Colombia, Mexico, Peru, and Uruguay)
This material is for use with an institutional investor or a qualified investor only. All information contained herein is confidential and is for the exclusive use and review of the intended addressee, and may not be passed on to any third party. This material is provided for informational purposes only and does not constitute a public offering, solicitation or recommendation to buy or sell for any product, service, security and/or strategy. A decision to invest should only be made after reading the strategy documentation and conducting in-depth and independent due diligence.
ASIA PACIFIC
Hong Kong: This document has been issued by Morgan Stanley Asia Limited, CE No. AAD291, for use in Hong Kong and shall only be made available to “professional investors” as defined under the Securities and Futures Ordinance of Hong Kong (Cap 571). The contents of this document have not been reviewed nor approved by any regulatory authority including the Securities and Futures Commission in Hong Kong. Accordingly, save where an exemption is available under the relevant law, this document shall not be issued, circulated, distributed, directed at, or made available to, the public in Hong Kong.
Singapore: This material is disseminated in Singapore by Morgan Stanley Investment Management Company, Registration No. 199002743C. This material should not be considered to be the subject of an invitation for subscription or purchase, whether directly or indirectly, to the public or any member of the public in Singapore other than (i) to an institutional investor under section 304 of the Securities and Futures Act, Chapter 289 of Singapore (“SFA”), (ii) to a “relevant person” (which includes an accredited investor) pursuant to section 305 of the SFA, and such distribution is in accordance with the conditions specified in section 305 of the SFA; or (iii) otherwise pursuant to, and in accordance with the conditions of, any other applicable provision of the SFA. This material has not been reviewed by the Monetary Authority of Singapore.
Australia: This material is provided by Morgan Stanley Investment Management (Australia) Pty Ltd ABN 22122040037, AFSL No. 314182 and its affiliates and does not constitute an offer of interests. Morgan Stanley Investment Management (Australia) Pty Limited arranges for MSIM affiliates to provide financial services to Australian wholesale clients. This material will not be lodged with the Australian Securities and Investments Commission.
Japan
For professional investors, this material is circulated or distributed solely for informational purposes. For non-professional investors, this material is provided in connection with Morgan Stanley Investment Management (Japan) Co., Ltd. (“MSIMJ”)’s business with respect to discretionary investment management agreements (“IMA”) and investment advisory agreements (“IAA”). This does not constitute a recommendation or solicitation of transactions nor offers any particular financial instruments. Under an IMA, with respect to the management of client assets, the client prescribes basic management policies in advance and commissions MSIMJ to make all investment decisions based on an analysis of the value, etc. of the securities, and MSIMJ accepts such commission. The client shall delegate to MSIMJ the authorities necessary to make such investment decisions. MSIMJ exercises these delegated authorities accordingly, and the client shall not make individual instructions. All investment profits and losses belong to the clients; principal is not guaranteed. Please consider the investment objectives and nature of risks before investing. As an investment advisory fee for an IAA or an IMA, the amount of assets subject to the contract multiplied by a certain rate (the upper limit is 2.20% per annum (including tax)) shall be incurred in proportion to the contract period. For some strategies, a contingency fee may be incurred in addition to the fee mentioned above. Indirect charges also may be incurred, such as brokerage commissions for underlying securities. Since these charges and expenses vary by contract and other factors, MSIMJ cannot present the rates, upper limits, etc. in advance. All clients should read thoroughly the Documents Provided Prior to the Conclusion of a Contract carefully before executing an agreement. This material is distributed in Japan by MSIMJ, Registered No. 410 (Director of Kanto Regional Finance Bureau (Financial Instruments Firms)), Membership: the Japan Securities Dealers Association, the Investment Management Association of Japan and the Type II Financial Instruments Firms Association.


