

 Top

Investors are debating whether generative AI will disrupt incumbent software companies. We believe the more compelling investment question may be different: Which organizations can harness AI to amplify human productivity?
Recent comments from technology executives suggest this dynamic may already be emerging. Cloudflare CEO Matthew Prince has described team members becoming "two, 10, even 100 times more productive," while Affirm founder Max Levchin has discussed the emergence of the "10,000x engineer."
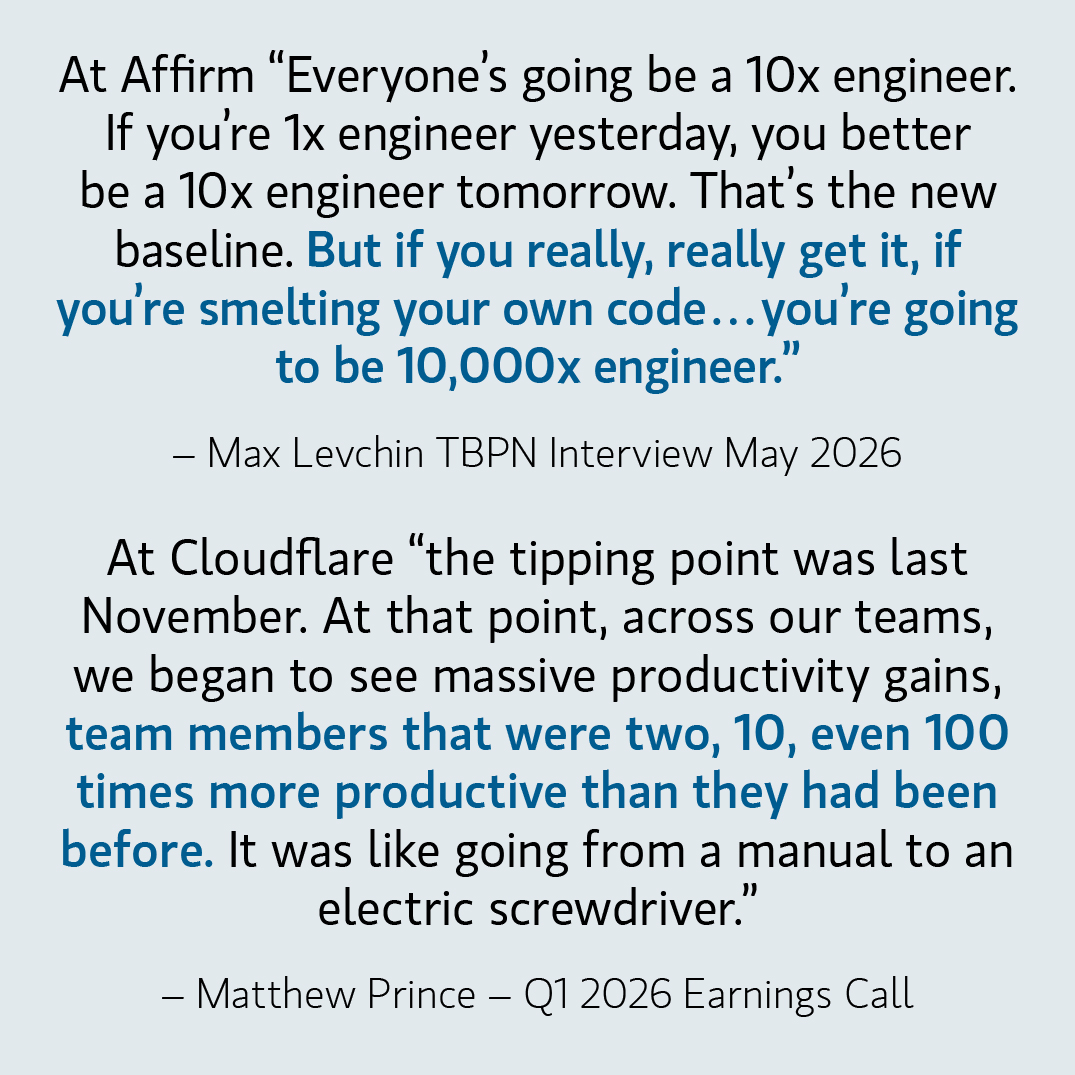
The precise multiples matter less than the underlying observation: With new tools (like Anthropic’s Claude and OpenAI Codex) engineer productivity may be accelerating faster than engineer compensation.
Read our original AI Beneficiaries Research
Can We Measure it?
We developed a new Culture Quant metric: The AI Productivity Spread. This is designed to test whether a budding productivity surplus is observable across companies.
- 750 Publicly traded technology companies
- ~40 million employee records
- Five years of workforce history
Using alternative data, we isolated technical employees (i.e. the tinkerers) – typically the earliest adopters of AI tools – and compare growth in revenue per technical employee with growth in average compensation for the same cohort.
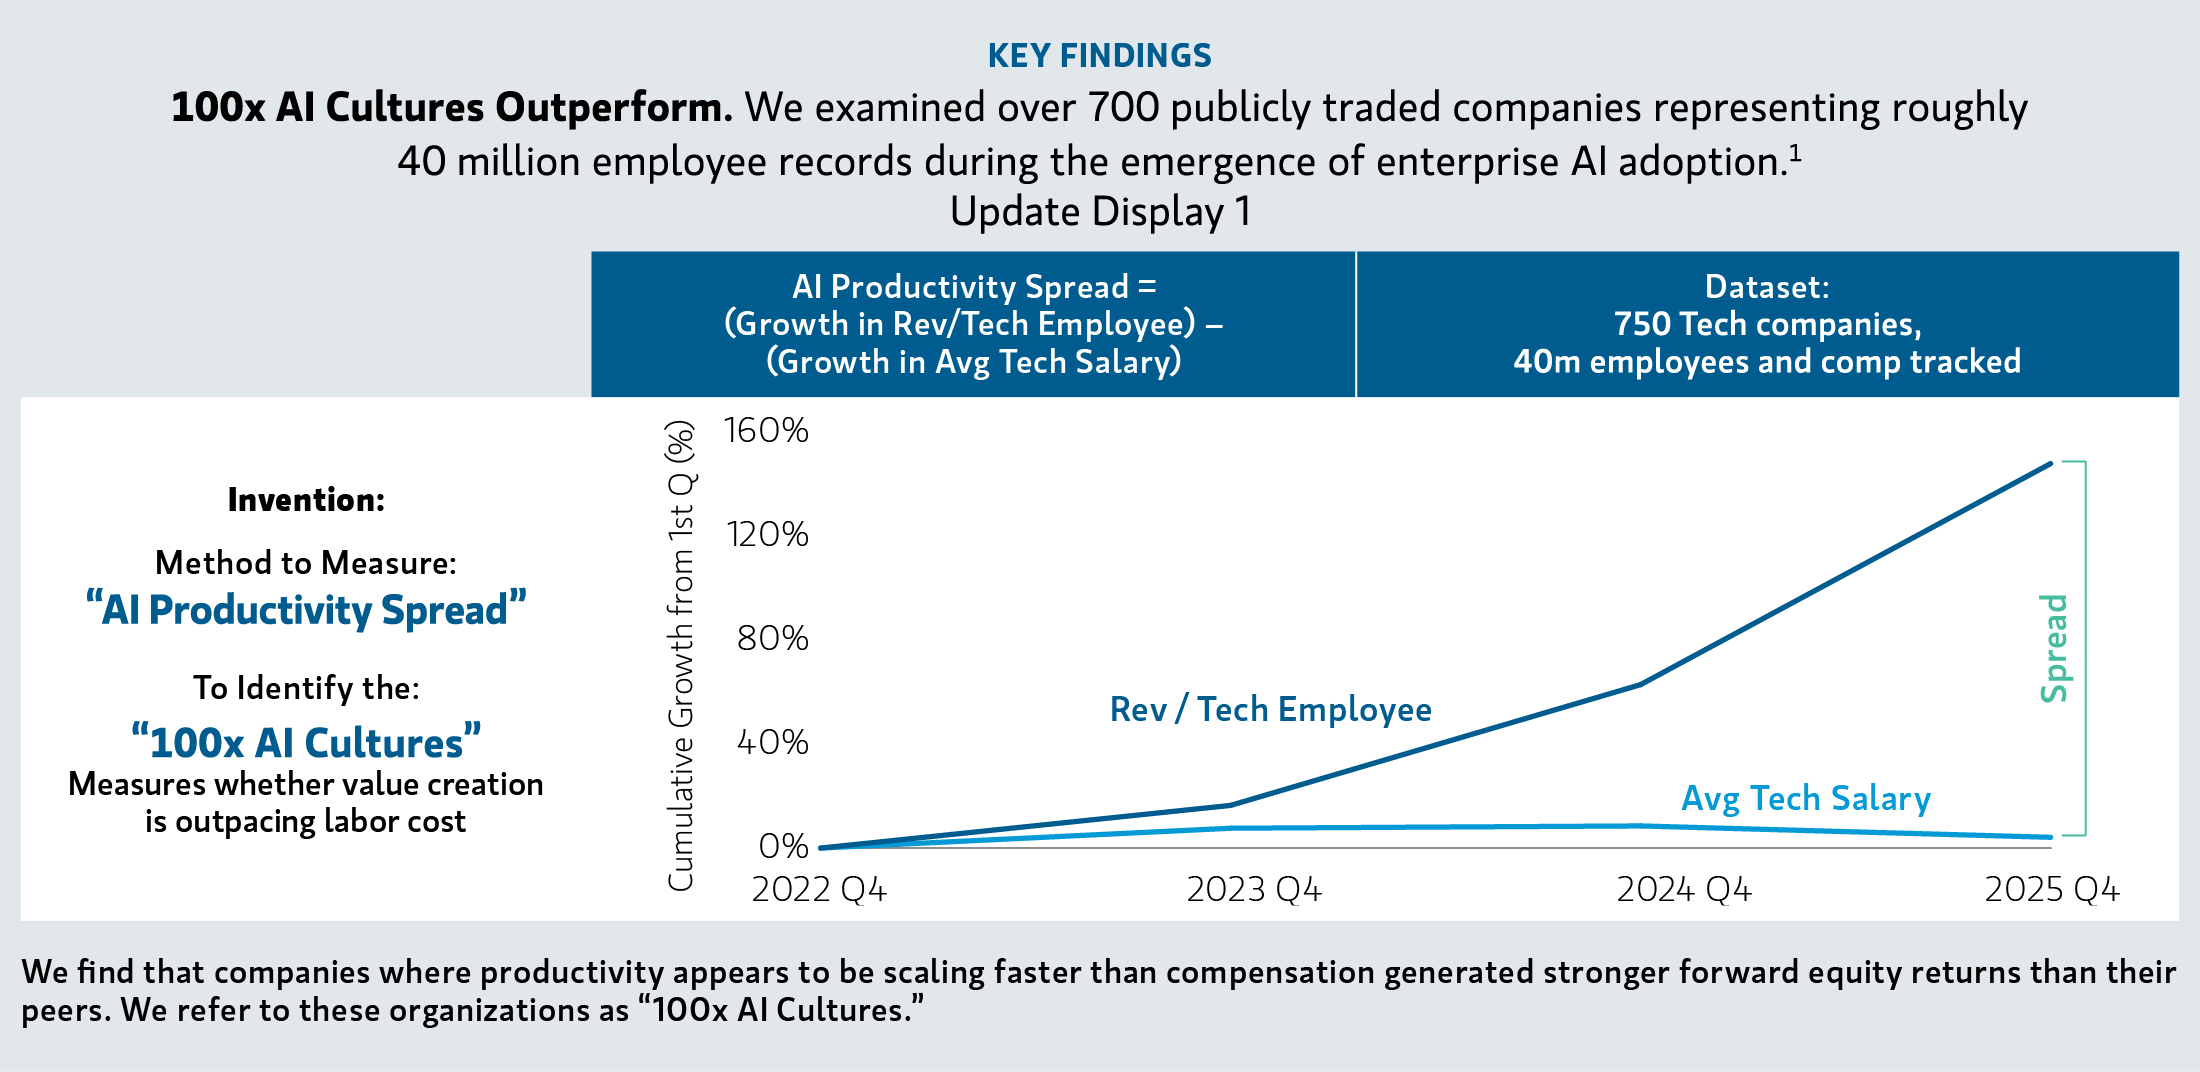
1 Source: Morgan Stanley Investment Management (MSIM), Revelio Labs as of 3/31/2026. The views expressed here are those of Counterpoint Global and do not reflect the opinions of all Investment teams at MSIM or the views of the firm as a whole and may not be reflected in the strategies and products that the Firm offers. The information above is provided for informational purposes only and do not constitute and should not be construed as investment advice or recommendations. AI Productivity Spread - defined as trailing 4Q growth in revenue per tech employee minus trailing 4Q growth in average tech salary. Avg tech salary reflects headcount-weighted comp across tech roles, geographies, and seniority levels. Chart shows average revenue per tech employee and salary for top-quintile companies over time. A persistence filter is applied, including only companies that appear in the top quintile in at least 6 quarters to reduce one-off entrants.
What Did We Find?
Companies with the highest AI Productivity Spread generated materially stronger forward stock returns than median and bottom-quintile peers.
AI Productivity Spread by Quintile
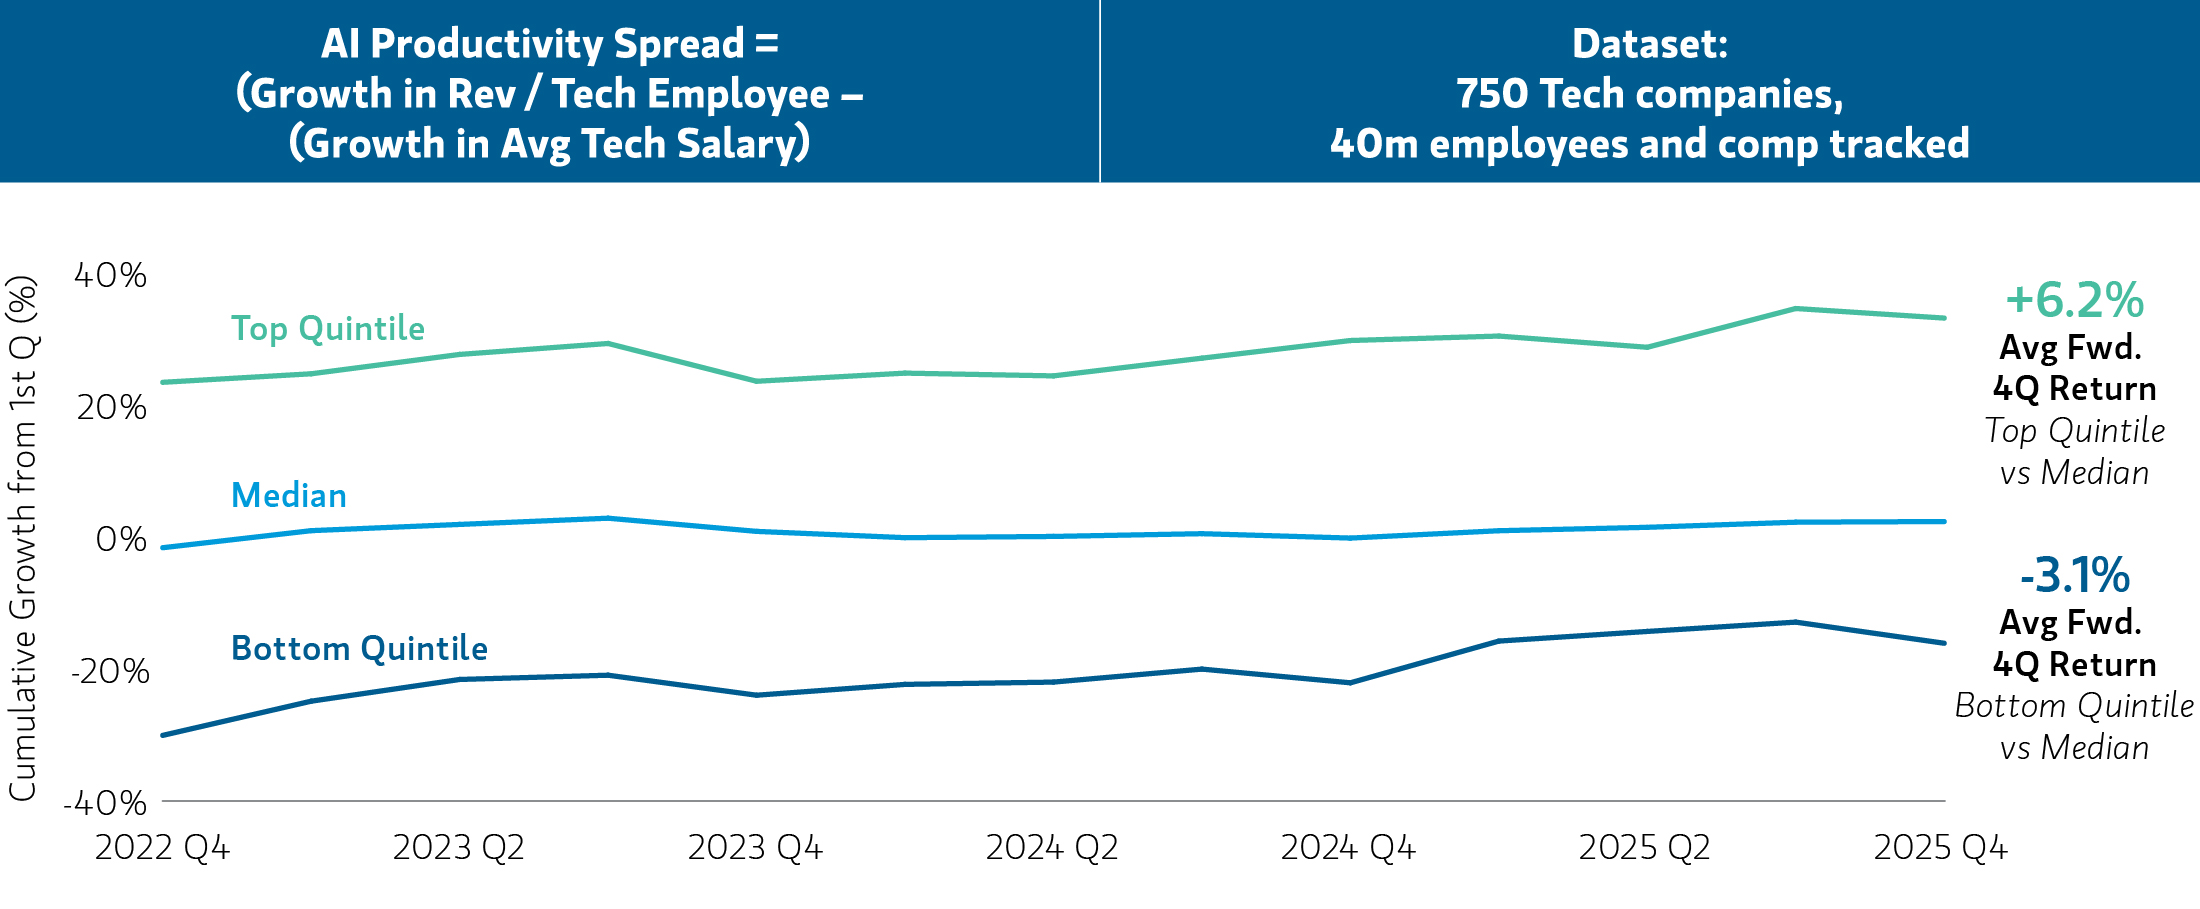
Source: MSIM, Revelio Labs, FactSet. As of 3/31/2026. Past performance is no guarantee of future results. The views expressed here are those of Counterpoint Global and do not reflect the opinions of all Investment teams at MSIM or the views of the firm as a whole and may not be reflected in the strategies and products that the Firm offers. The information above is provided for informational purposes only and do not constitute and should not be construed as investment advice or recommendations. Companies are sorted into quintiles each quarter based on their AI Productivity Spread. Returns represent forward 4-quarter stock performance, averaged across companies within each quintile and over time on a rolling basis.
AI Productivity Spread by Quintile
We refer to these as 100X AI Cultures.
While we don’t interpret the relationship as causal, we believe a new form of productivity arbitrage may be emerging inside certain organizations: AI-enabled output may be scaling faster than labor costs can adjust.
Traditional financial disclosures rarely capture these dynamics directly. The AI Productivity Spread may therefore provide another lens into something investors have struggled to quantify: organizational adaptability.
Why it Matters
Software engineers may be the canary in the coal mine. As early adopters of generative AI tools, they are among the first workers where we would expect AI-driven productivity gains to become observable. If these gains eventually diffuse into other knowledge-intensive functions, the implications could extend well beyond software.
That raises a second-order question: Who captures the resulting economic surplus? Customers may benefit through lower prices, workers through higher compensation, and shareholders through higher profits.
Case Study: Cloudflare
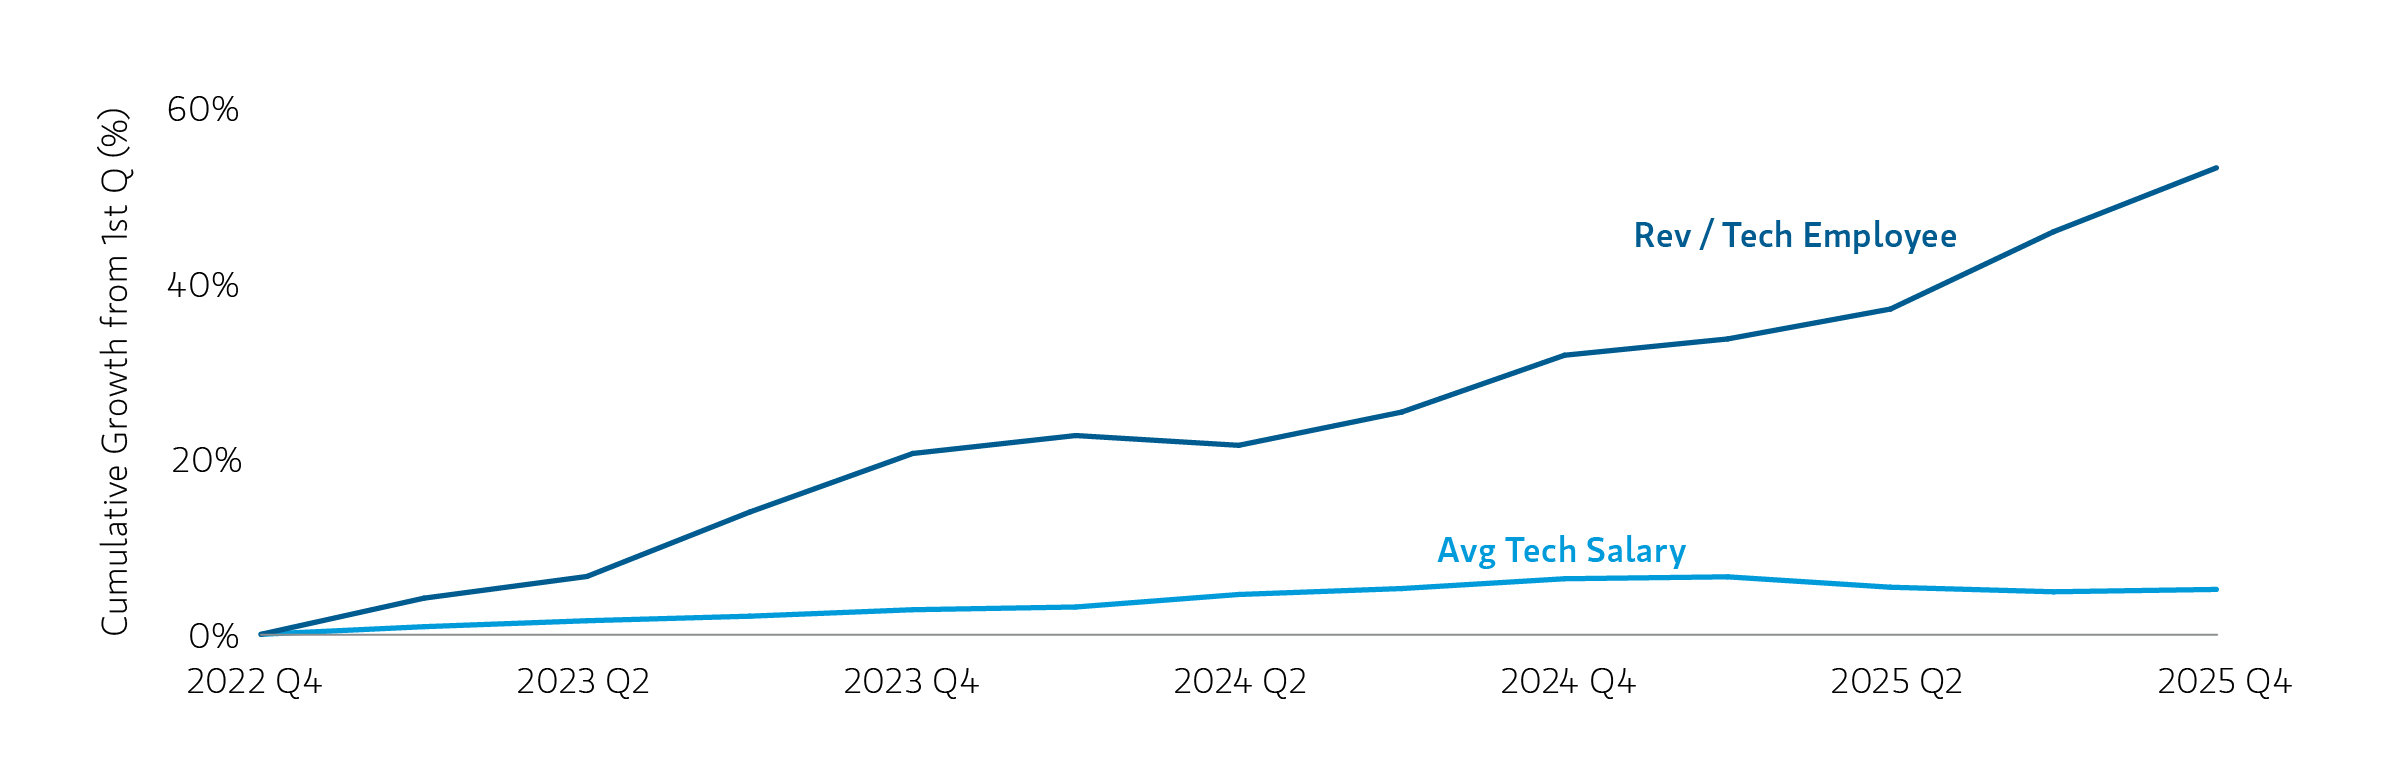
Source: Morgan Stanley Investment Management, Revelio Labs, FactSet. As of 3/31/2026. The views expressed here are those of Counterpoint Global and do not reflect the opinions of all Investment teams at MSIM or the views of the firm as a whole and may not be reflected in the strategies and products that the Firm offers. The information above is provided for informational purposes only and do not constitute and should not be construed as investment advice or recommendations with respect to the securities listed.
Cloudflare is a holding in the Tailwinds Strategy as of 6/30/2026, representing 0.68% of the holdings.
Case Study: Cloudflare
AI may become ubiquitous, but the ability to absorb it effectively may not. As intelligence becomes increasingly abundant, the rate-limiting factor may shift towards execution. The organizations that empower their people with the best tools and adapt the fastest may be best positioned to create disproportionate value.
For years Culture Quant has sought to make the invisible more visible by measuring culture through observable behavior. In an AI-driven economy, we believe adaptability – the ability to translate increasingly accessible intelligence into labor productivity – may become an important source of competitive advantage.
Featured Insights