


 Top
Top

Monthly Review
September was the month the global tightening cycle arrived. The Federal Reserve, the European Central Bank and the Bank of Japan all raised rates within nine days of each other, and developed-market government bond yields sold off sharply across most major markets and maturities. The striking feature was where the adjustment came from: real yields rather than inflation expectations. Credit then repriced broadly in order of quality, with investment grade proving relatively resilient while the weakest high yield cohorts gapped wider. Volatility rose steeply in rates and only modestly in equities.
The selloff was broad and concentrated in real rates. The U.S. 2-year Treasury yield rose 55 basis points (bps) and the 10-year 53bps to 5.28%, crossing 5% for the first time since 2023 in the days before the Fed met, with the back of the curve flattening as the 5s30s spread narrowed 20bps. Crucially, 10-year real yields rose 49bps while breakevens widened only 5bps, so almost the entire move was a repricing of real rates rather than of inflation expectations, an unusual split in a month when Brent crude reached $106 a barrel. Gilts and Australian and Canadian government bonds sold off in sympathy, Italian yields rose 46bps, and only Japan was spared, where normalization was already well advanced. Euro-area spreads to Germany widened, with France the clear outlier at 42bps wider. In France, longstanding fiscal concerns were compounded by deteriorating technicals, as domestic buyers failed to step in and stop-loss activity accelerated the move, contributing to broader deleveraging across European government bonds.
Three of the four major central banks tightened. The Fed raised its target range by 25bps to 3.75%-4.00% on 16 September, its first increase since 2023, in a unanimous vote and with most participants projecting at least one further hike this year. The ECB had moved six days earlier, lifting its deposit facility rate to 2.50% and warning that the conflict in the Middle East would keep inflation above target for an extended period. The Bank of Japan followed on 18 September, raising its policy rate to 1.25% by a seven-to-two majority, the highest level since 1995. The Bank of England was the exception, holding at 3.75% by six votes to three after UK CPI rose to 3.1% in August. U.S. CPI held at 3.4% year over year with core little changed. The common thread was energy: each statement pointed to the oil shock, and none to domestic demand.
The dollar reversed its summer decline, with the broad dollar index rising 2.0%. The move was close to universal, the euro falling 2.5% and sterling, the Swedish krona and most commodity currencies losing more ground still, while the Mexican peso was the weakest major at 5.9% lower. The yen was the notable exception, appreciating 1.5% as the Bank of Japan tightened, with the Korean won the only other gainer of note. For a month in which three central banks raised rates, the dollar's strength is a reminder that relative real yields rather than policy direction alone drive currencies.
Investment grade (IG) credit was conspicuously resilient. U.S. spreads widened only 2bps to 80bps OAS, absorbing the move in underlying yields with little difficulty, though financials underperformed industrials. Euro investment grade fared considerably worse, widening 12bps to 91bps and led by financials and subordinated insurance, while sterling credit widened 5bps to the same level. The regional divergence reflected weaker European technicals rather than a comparable deterioration in fundamentals, with French sovereign volatility, higher energy prices, heavier issuance and fund outflows weighing on Euro IG while U.S. credit continued to benefit from stronger inflows and attractive all-in yields.
High yield repriced in strict order of quality. U.S. high yield widened 50bps to 311bps, but the move was heavily skewed, with BB-rated debt holding up comparatively well while CCC widened 150bps to 1,007bps. Euro high yield followed almost exactly, widening 45bps to 305bps with an even sharper move in its lowest tier, and sterling high yield was weaker again. This is the mirror image of August, when compression was concentrated in the stronger tiers and CCC cheapened against a rallying index. Two consecutive months in which the lowest-rated cohort underperformed in both directions is a more informative signal than either month taken alone. Heavy primary issuance, fund outflows and greater idiosyncratic volatility added to the pressure, reinforcing the preference for higher-quality credits as lower-rated capital structures became increasingly sensitive to issuer-specific news.
Securitized markets split along the volatility line. Agency mortgage backed securities (MBS) spreads widened 13bps to 125bps versus comparable Treasuries as the MOVE index of implied rate volatility rose 47%. Higher yields and sharply higher rate volatility extended mortgage durations and complicated hedging, while several traditional marginal buyers remained cautious. With fewer than 1% of outstanding mortgages in the money to refinance, however, the pressure reflected convexity and technical conditions rather than rising prepayment risk or deteriorating housing fundamentals. Securitized credit went the other way, with BBB CMBS spreads tightening modestly and AAA Asset-Backed Securities (ABS) finishing slightly firmer. Agency paper widening on volatility while credit-sensitive tranches held or improved argues that the month's pressure was a rates event rather than any deterioration in collateral.
Emerging markets (EM) were the month's surprise. External sovereign spreads widened just 1bp to 218bps and EM corporate spreads by a similar margin, barely registering a shock that moved U.S. high yield fifty times as far, and Latin American sovereigns actually tightened. Local markets divided along policy lines, with Brazilian 10-year yields falling 56bps as the central bank cut the Selic to 13.75% in a fifth consecutive reduction, while Mexican yields rose 33bps and most of central Europe sold off. EM resilience through a synchronized developed-market tightening and a sharp move in oil was the most notable relative performance of the month. The resilience was not uniform, however, as late-month technical deterioration and country-specific developments produced widening in select markets even as the broader asset class remained comparatively well supported.
Overall, September delivered the tightening that August had only priced. The notable feature was not the size of the selloff but its composition: real yields carried almost all of it while inflation expectations held, which suggests investors credited central banks with responding to the energy shock rather than accommodating it. Dispersion again did the discriminating, and in a consistent direction, favoring investment grade over high yield, U.S. over European credit, securitized credit over agency paper, and emerging over developed markets. With policy now moving and the Fed's own projections pointing to more, the premium on carry, relative value and active security selection over broad credit beta rose rather than fell.
Display 1: Asset Performance Year-to-Date (%)
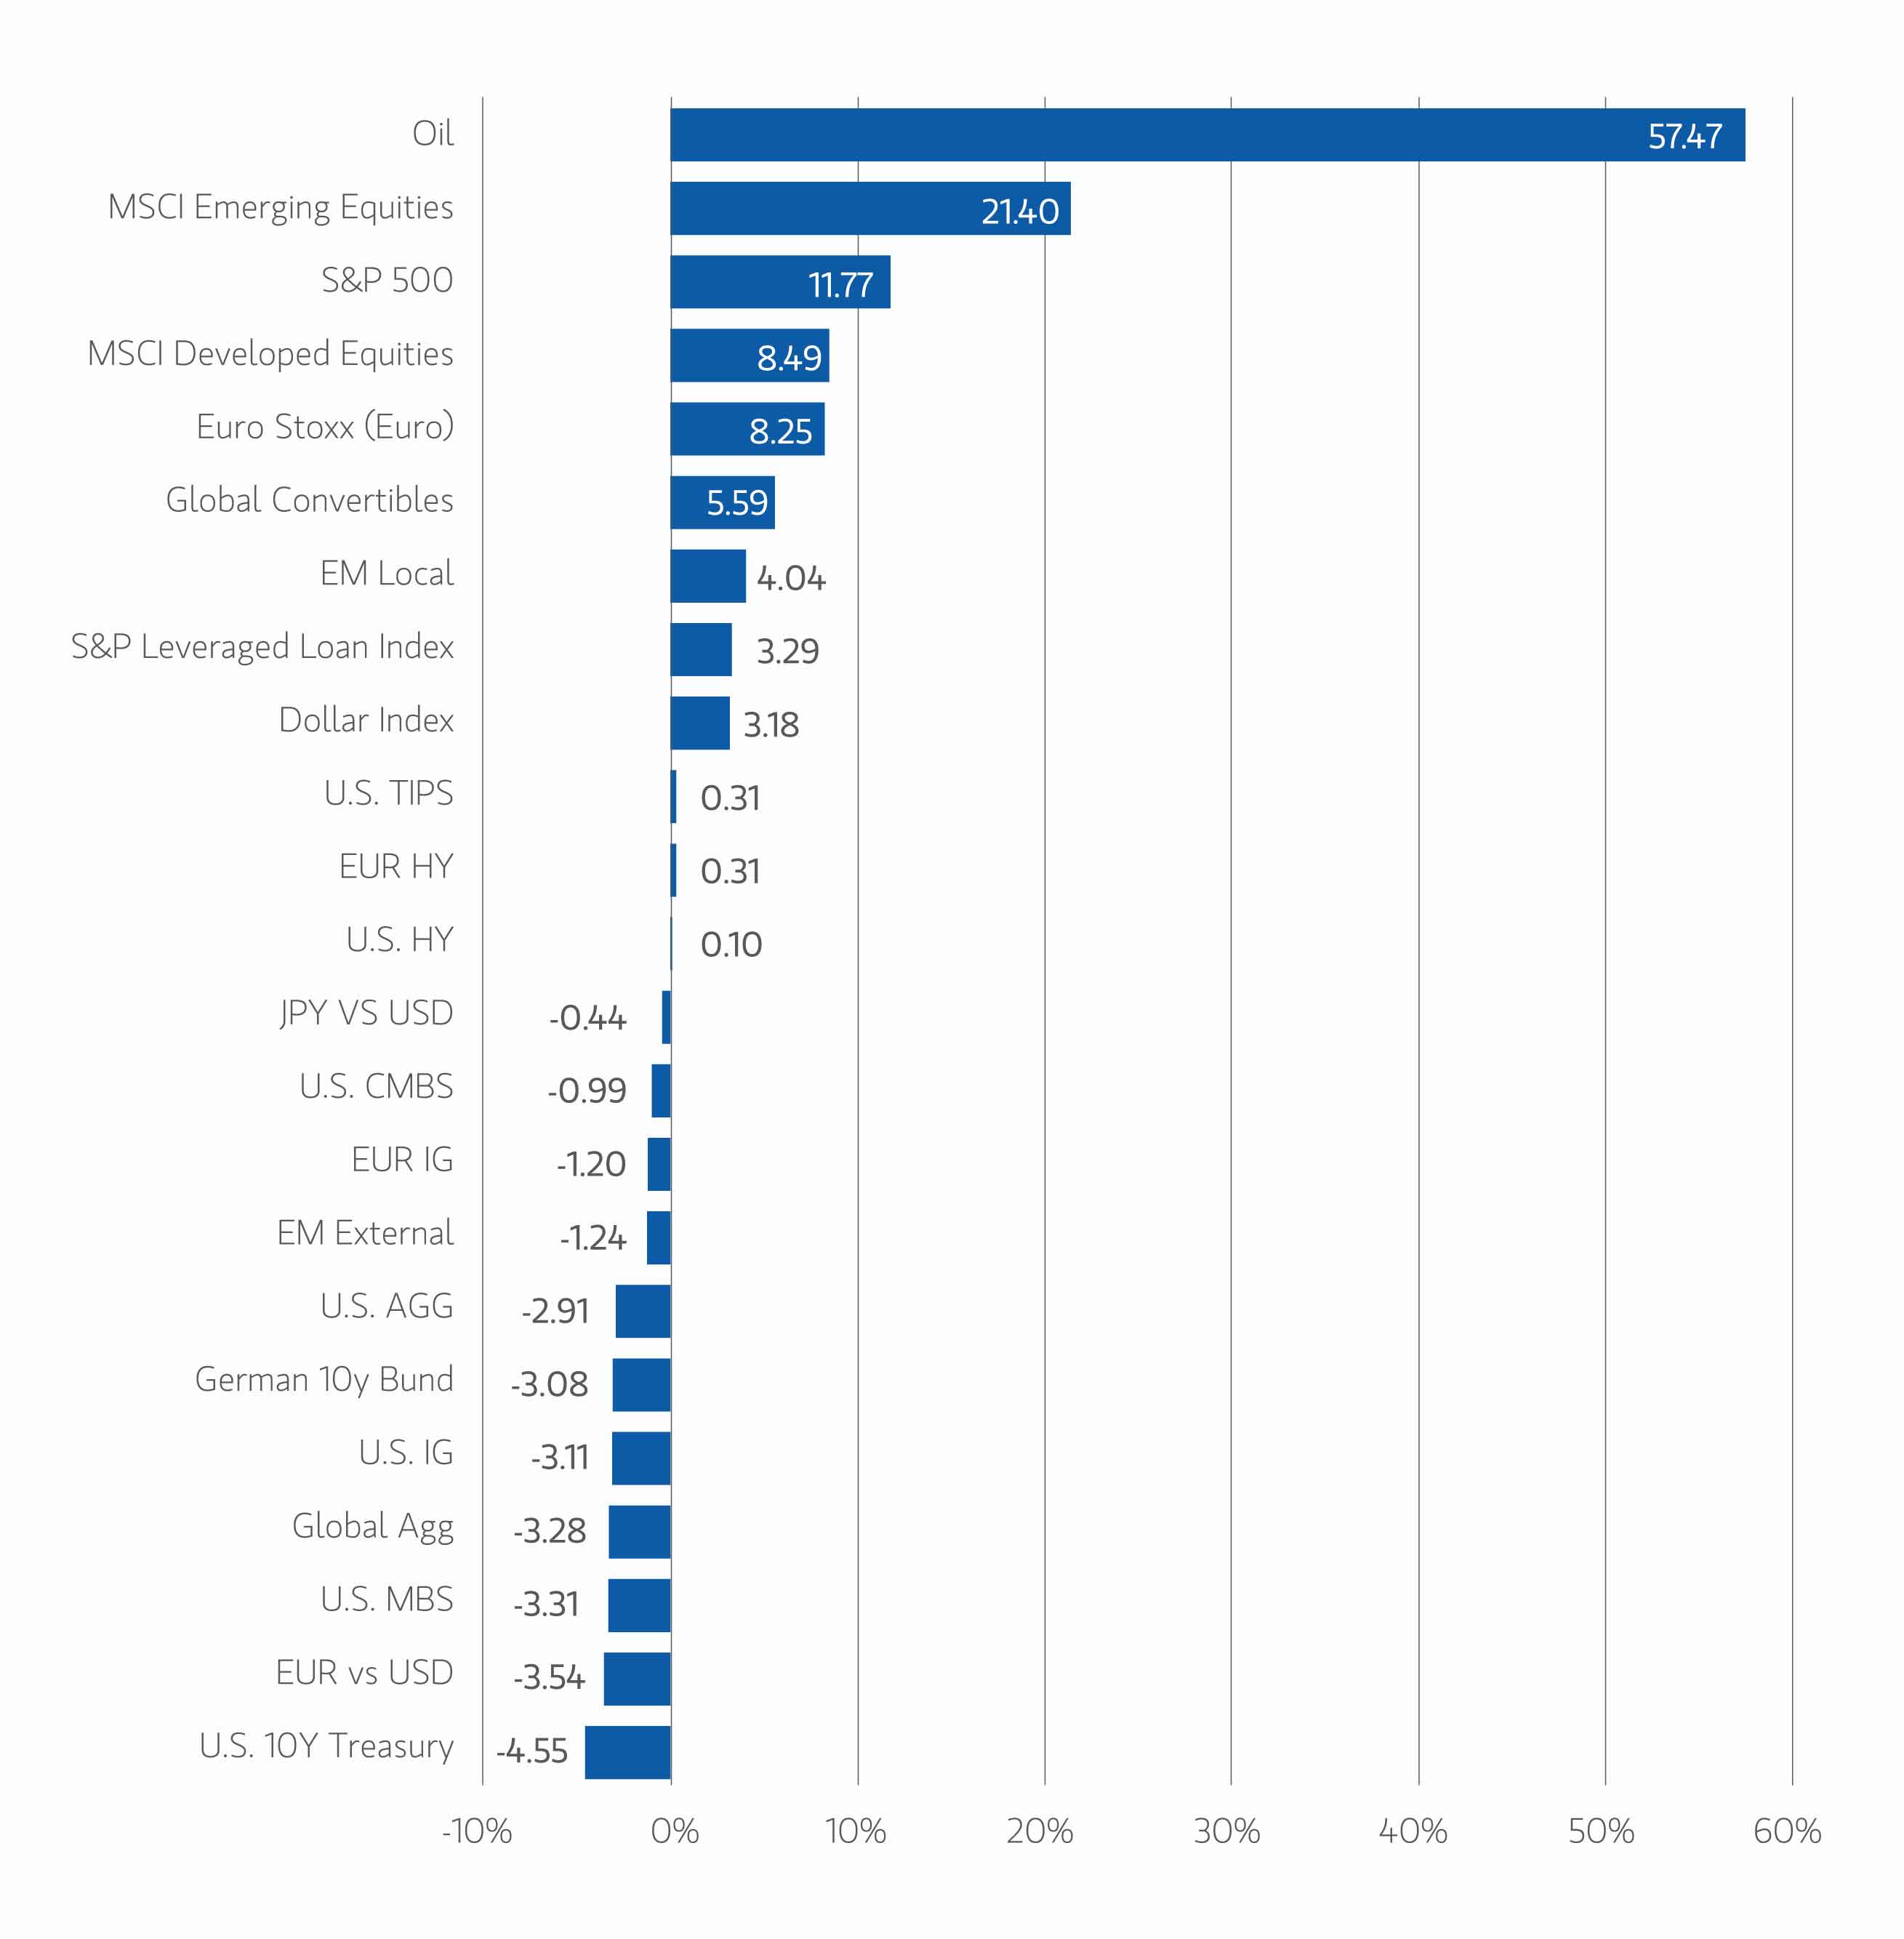
Note: USD-based performance. Source: Bloomberg. Data as of September 30, 2026. The indexes are provided for illustrative purposes only and are not meant to depict the performance of a specific investment. Past performance is no guarantee of future results.
Display 1: Asset Performance Year-to-Date (%)
Display 2: Currency Monthly Changes versus USD
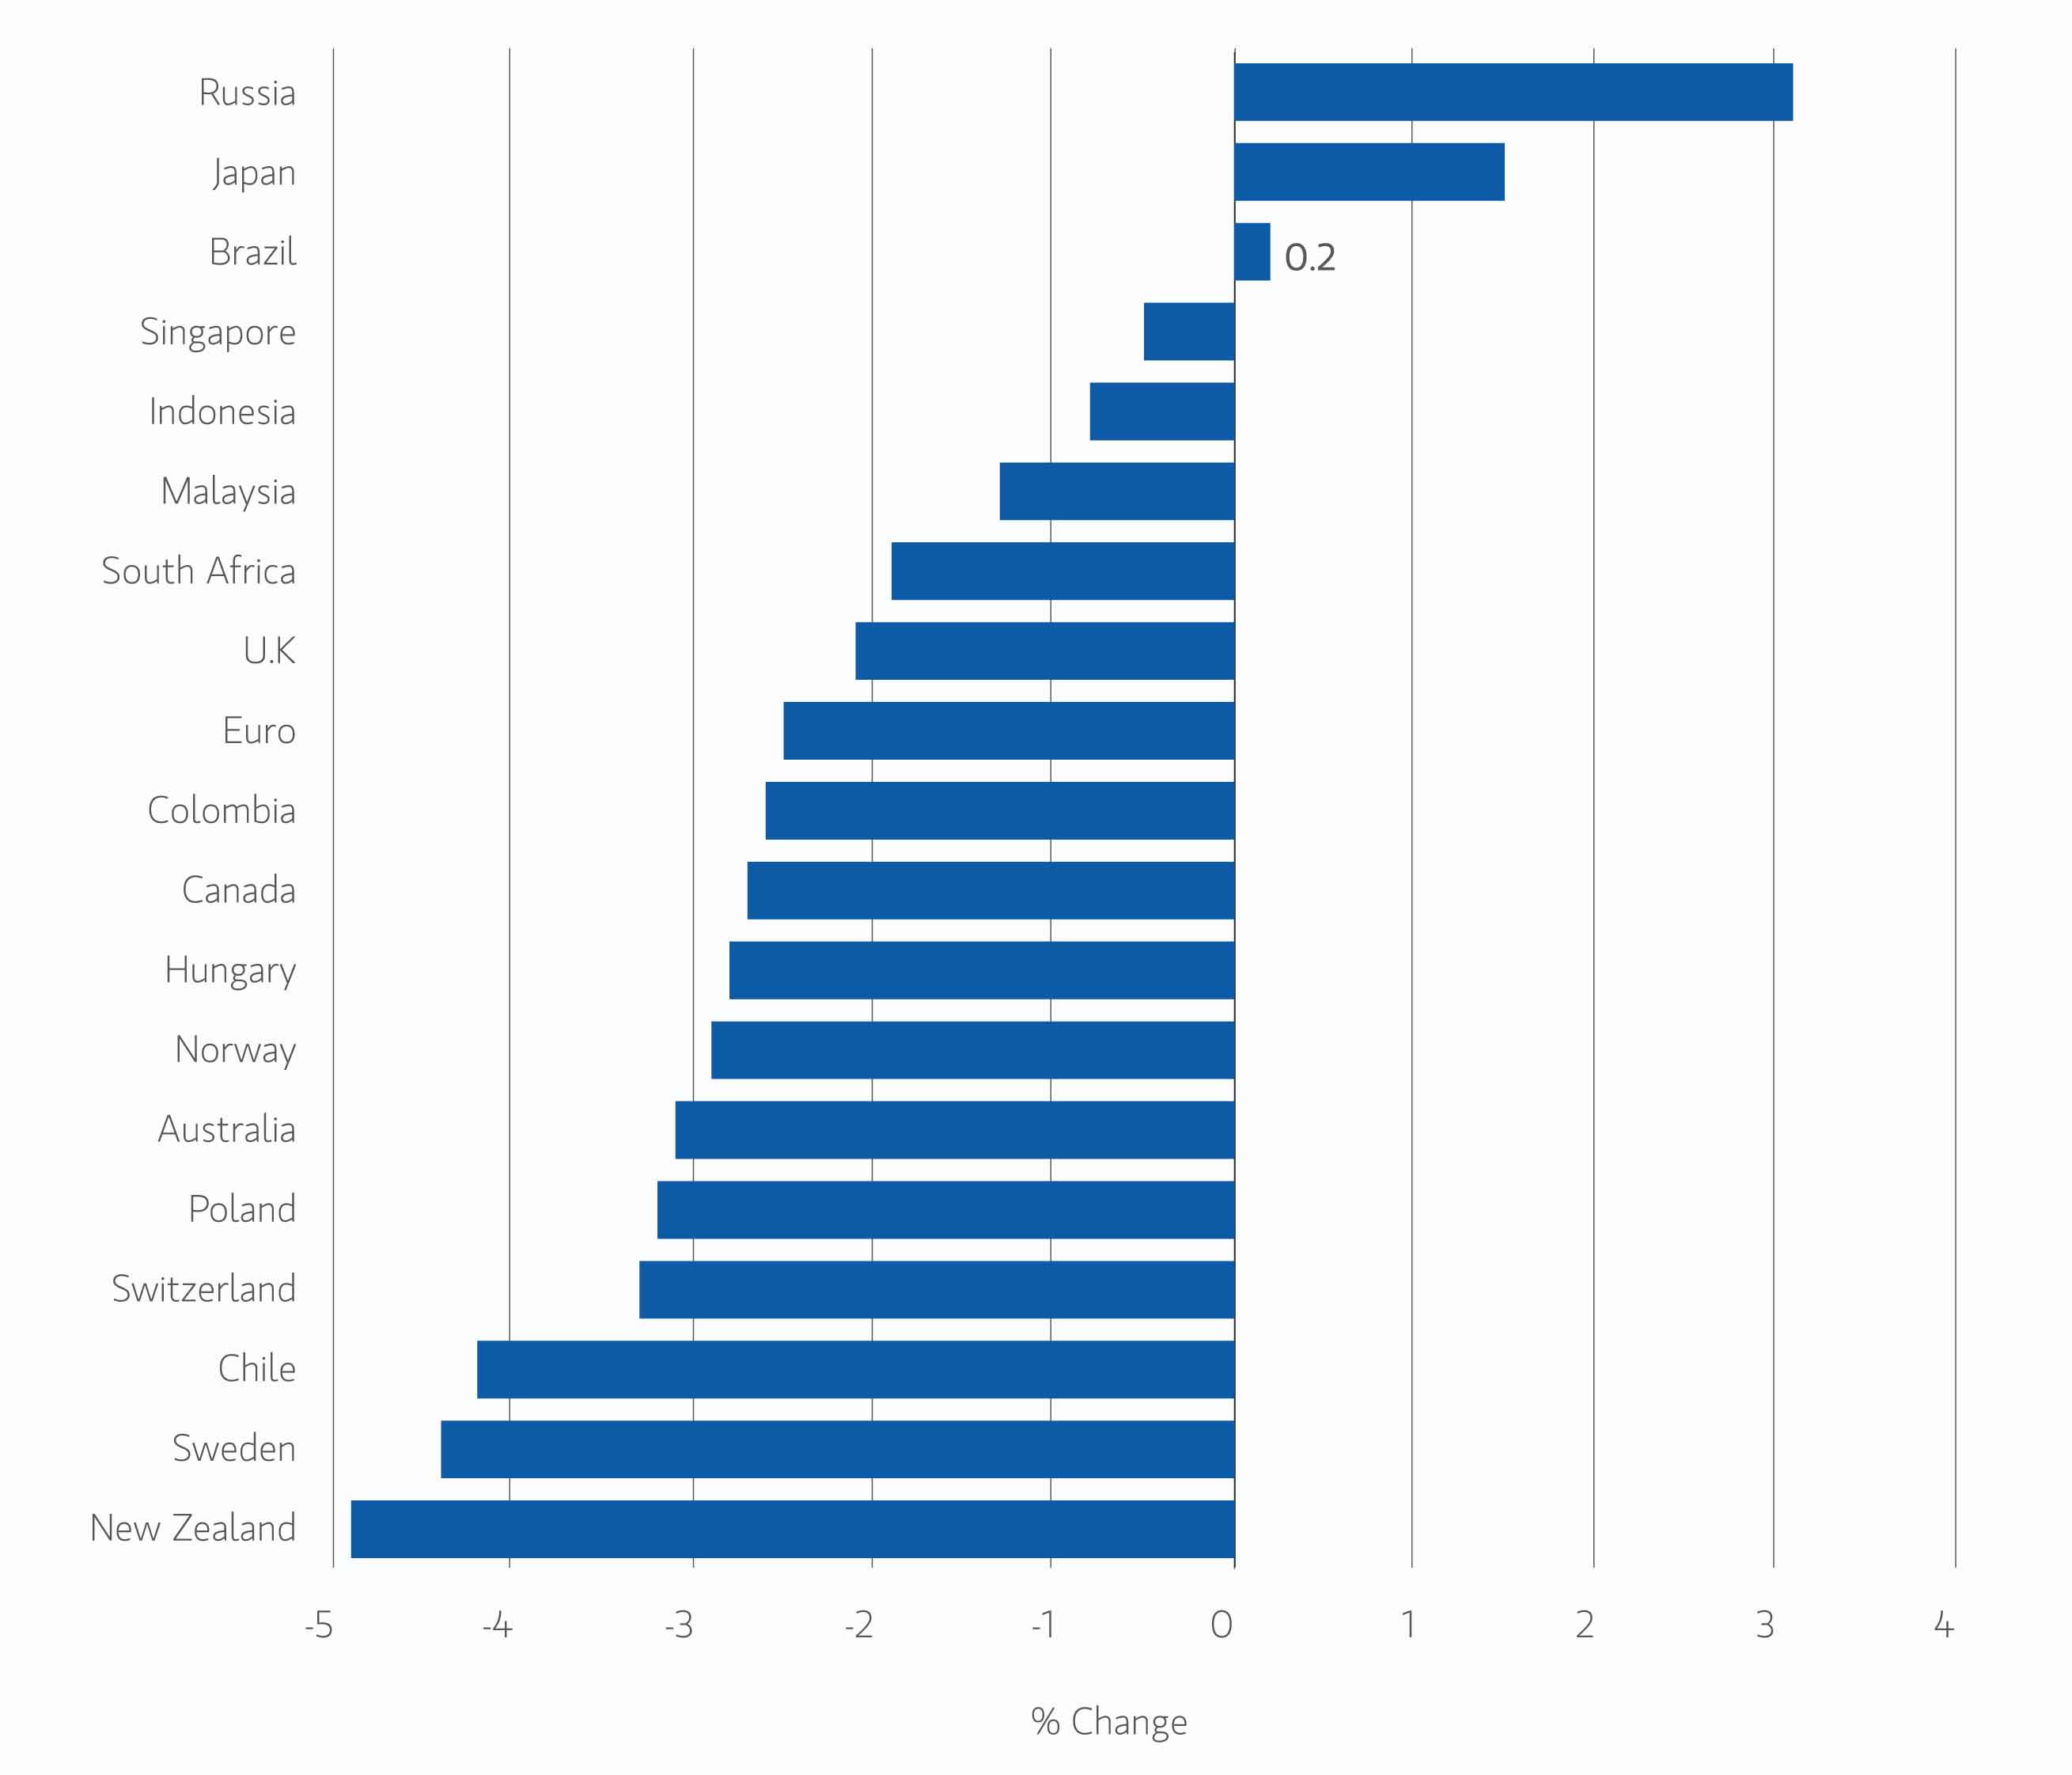
Note: Positive change means appreciation of the currency against the USD.
Source: Bloomberg. Data as of September 30, 2026.
Display 2: Currency Monthly Changes versus USD
Display 3: Major Monthly Changes in 10-Year Yields and Spreads
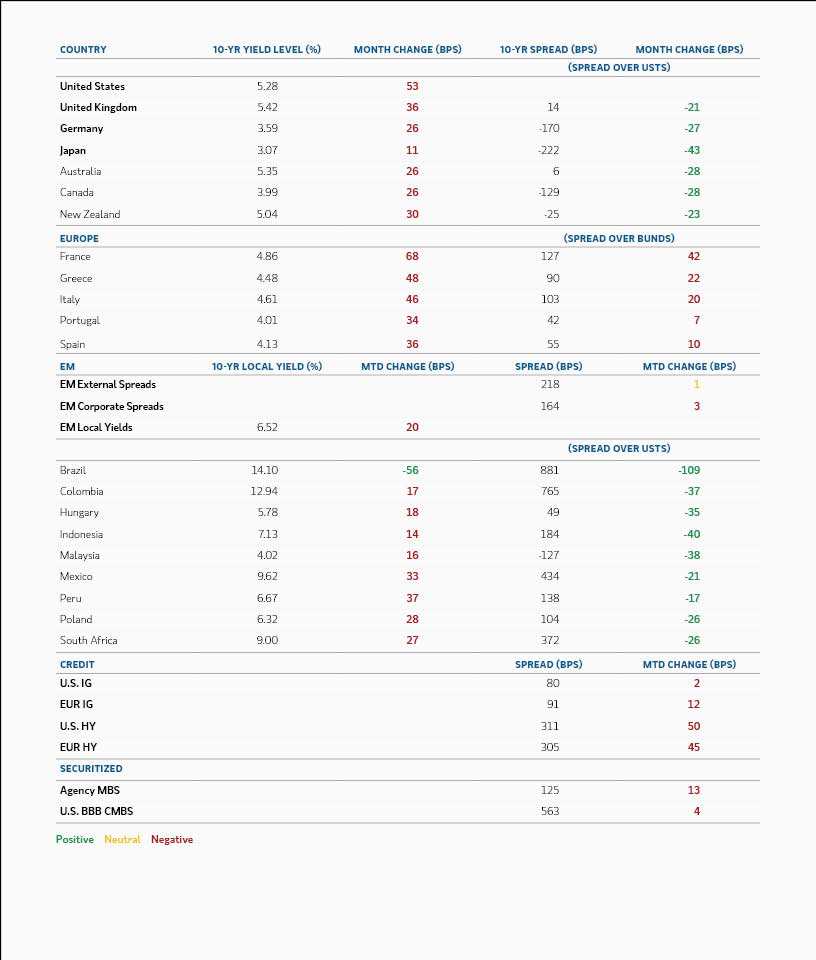
Source: Bloomberg, JPMorgan. Data as of September 30, 2026.
Display 3: Major Monthly Changes in 10-Year Yields and Spreads
Broad Markets Fixed Income Global Asset Allocation and Outlook
Developed Market Rate/Foreign Currency
(Selective long duration, neutral curve positioning, selective high-carry FX)
Our views remain grounded in a macro environment where growth has proven resilient, but the impact of increasingly restrictive monetary policy is likely to become more visible over the coming quarters. In the U.S., continued strength in activity and persistent inflation have supported expectations for additional tightening, while higher yields have already tightened financial conditions materially. Although growth may remain resilient in the near term, we expect it to increasingly meet rather than exceed expectations as the cumulative effects of higher rates work through the economy.
Against this backdrop, we retain a selective long-duration bias, with our strongest expression concentrated in New Zealand relative to U.S. rates. Rather than taking broad directional duration exposure, we continue to favor cross-market opportunities where relative growth and policy expectations appear mispriced. Recent volatility has prompted a reduction in overall duration risk, particularly in the U.S., while higher yields have also created more attractive entry points in markets where growth appears weaker relative to prevailing policy settings.
The recent rise in global yields has improved the prospective return profile for high-quality fixed income. Current yield levels provide a meaningful income cushion, while we believe the U.S. 10-year Treasury is approaching levels that should become increasingly restrictive for corporate, consumer, and housing activity. This creates a more balanced duration opportunity, even as near-term inflation and policy risks argue against taking excessive directional exposure.
Inflation remains a central macro risk, and we maintain exposure to U.S. 10-year breakevens. Persistent underlying price pressures, elevated nominal growth, and uncertainty around the timing and magnitude of further Federal Reserve tightening continue to support mitigation against the risk that inflation remains above target for longer than markets currently anticipate.
We remain broadly neutral on global curve direction while expressing selective relative-value views across markets. Current positioning favors differences in curve shape between the U.S. and Canada, alongside a flatter long-end profile in Japan, rather than a broad global steepening or flattening thesis. This approach reflects differing policy paths, fiscal dynamics, and term-premium behavior across developed markets.
In foreign exchange, positioning remains selective and risk-controlled. We favor the Japanese yen relative to the U.S. dollar, while using options to help limit downside risk. More broadly, currency exposure remains modest as relative policy expectations, growth differentials, and volatility continue to shift quickly across markets.
Emerging Market Debt
(Reducing overweight)
We have started reducing our overweight on emerging market (EM) debt following a period of strong performance, tight credit valuations, and a less supportive global policy backdrop. Elevated real yields and improving fundamentals continue to create attractive opportunities in select countries, but broad EM credit spreads offer less compensation than earlier in the year and the stronger U.S. dollar has increased the hurdle for indiscriminate risk-taking.
Portfolio risk has consequently been reduced, with greater emphasis on preserving flexibility until more compelling opportunities emerge. EM credit spreads remained relatively resilient through much of September, but deteriorating technicals and renewed widening late in the month reinforced our preference for selective exposure rather than broad credit beta. Portfolio risk remains near multi-year lows, reflecting a more cautious approach while macro and political uncertainty remain elevated.
Within the asset class, we increasingly favor local rates and country-specific opportunities where monetary policy, political developments, and external balances provide identifiable catalysts. Recent developments in Brazil illustrate the potential for political outcomes to create meaningful opportunities in both rates and currencies, while markets such as Argentina, Romania, and Ecuador highlight the importance of avoiding broad regional generalizations.
Carry and income remain important sources of expected return, but valuations require greater selectivity. We continue to favor countries with credible monetary frameworks, improving external balances, and attractive real-yield differentials, while maintaining a more cautious posture toward areas where strong-dollar pressure, political uncertainty, or tight credit spreads leave limited margin for error.
Corporate Credit
(Underweight IG, small overweight HY)
We remain underweight investment grade corporates as tight valuations continue to offer limited mitigation against macro and rates volatility. September's widening improved valuations somewhat, but the move remained orderly and was driven primarily by broader market volatility rather than a deterioration in corporate fundamentals. Healthy balance sheets, resilient earnings, and attractive all-in yields continue to support the asset class, but carry rather than broad spread compression remains the primary source of expected return.
We no longer maintain a broad preference for European investment grade over the U.S. European credit underperformed materially during September as French sovereign volatility, higher energy prices, heavy primary issuance, and weaker fund flows pressured spreads. By contrast, U.S. IG technicals remained comparatively stronger, supported by continued inflows, attractive all-in yields, and issuance that came in below expectations. We therefore favor a more balanced regional approach, with security selection and relative value taking precedence over a broad geographic preference.
The recent widening has also created selective opportunities within areas of U.S. investment grade that previously offered insufficient compensation. We are increasingly willing to consider technology, hyperscaler, and data-center-related issuance where spreads have repriced materially and investors are being better compensated for construction, financing, and execution risks. The threshold for participation remains high, particularly given the expected growth in AI-related issuance and the increasing weight these securities may ultimately represent within fixed income benchmarks.
Fundamentals remain broadly solid, though later-cycle pressures continue to build through elevated M&A activity, infrastructure investment, AI-related capital expenditure, and higher shareholder distributions. We continue to favor issuers with resilient cash flows, strong balance sheets, and manageable refinancing needs while remaining cautious in sectors where technological disruption, leverage, or complex financing structures could weaken credit quality.
We maintain a modest overweight to select high-yield issuers. Recent widening has improved the opportunity set, but dispersion remains pronounced and lower-quality credits continue to lag. We therefore favor BB and higher-quality single-B issuers with resilient cash flows, manageable maturities, and strong pricing power rather than broad high-yield beta.
With much of the fundamental backdrop still supportive but macro volatility elevated, we expect active security selection to remain critical. Higher all-in yields have improved prospective income, but tight spreads across many higher-quality sectors continue to leave limited room for error.
Leveraged Loans
(Neutral)
We maintain a neutral stance on leveraged loans. The asset class continues to benefit from strong CLO demand and resilient retail flows, but recent outperformance has reduced its relative attractiveness versus high yield and other fixed-rate credit sectors. As a result, we are more selective about adding risk and increasingly focused on opportunities where spread compensation remains compelling.
Dispersion remains elevated across the market. Software and technology-linked issuers continue to face uncertainty around AI-related disruption, while lower-quality and more cyclical sectors have also experienced greater idiosyncratic weakness. We continue to favor higher-quality, mission-critical businesses with durable cash flows, strong interest coverage, and manageable maturity profiles.
Although policy rates remain elevated, current floating-rate borrowing costs have not yet translated into a material increase in defaults, in part because many issuers remain well hedged. CLO demand also continues to provide an important technical anchor for the market.
Overall, we continue to see selective opportunities in loans, but recent relative performance and tighter technicals argue for a more balanced stance versus high yield and other fixed-rate alternatives.
Securitized Products
(Overweight)
We remain overweight securitized products, although our view within the sector has become increasingly differentiated. Recent volatility has created more attractive relative-value opportunities across both agency and non-agency markets, while underlying credit fundamentals remain broadly stable.
Agency mortgage-backed securities have cheapened materially as higher Treasury yields, increased rates volatility, and extension risk pressured the sector. Exposure was reduced ahead of much of the widening, and the subsequent repricing has improved the opportunity set meaningfully. We remain constructive on agency MBS from a strategic perspective and are evaluating opportunities to rebuild exposure as valuations become more compelling, rather than treating the sector as an unconditional high-conviction overweight at current levels.
The fundamental mortgage backdrop remains supportive. With mortgage rates elevated, less than 1% of outstanding borrowers are currently in the money to refinance, materially reducing prepayment risk across most coupons. Recent extension has also improved convexity, with much of the mortgage stack now trading at discounts and closer to full extension, making the sector easier to hedge against further rate increases. The principal near-term question is technical demand, as banks, overseas investors, hedge funds, and REITs remain sensitive to stabilization in Treasury yields before increasing purchases.
Non-agency residential MBS remains one of the more attractive areas of structured credit. Spreads widened only modestly through the recent market volatility, while fundamentals remained broadly stable. Higher yields and somewhat wider spreads have improved prospective returns, particularly in higher-quality fixed-rate structures where investors can capture both Treasury yield and additional credit spread without assuming excessive lower-quality risk.
Commercial mortgage-backed securities remain attractive selectively, though refinancing risk is becoming increasingly important as higher rates feed through to property valuations and debt-service requirements. We continue to favor higher-quality properties with strong sponsors and visible cash-flow generation, where equity holders have both the ability and willingness to contribute capital if necessary. Lower-quality conduit exposure remains less attractive given the risk that refinancing challenges translate into more significant credit impairment.
Asset-backed securities continue to provide attractive diversification and income, supported by their shorter-duration profile and generally resilient fundamentals. Supply remains elevated across asset-backed securities (ABS), RMBS, and CMBS, making technical conditions an increasingly important consideration heading into year-end. We therefore continue to prioritize structures where collateral quality, cash-flow visibility, and spread compensation justify the additional complexity.
Overall, the recent widening has improved the relative-value opportunity across securitized markets, but we remain disciplined about entry levels. We favor higher-quality structures and sectors where volatility rather than deteriorating credit fundamentals has driven repricing, preserving capacity to add risk should technical pressures create further opportunities.
Featured Insights




RISK CONSIDERATIONS
Diversification neither assures a profit nor guarantees against loss in a declining market.
There is no assurance that a portfolio will achieve its investment objective. Portfolios are subject to market risk, which is the possibility that the market values of securities owned by the portfolio will decline and that the value of portfolio shares may therefore be less than what you paid for them. Market values can change daily due to economic and other events (e.g., natural disasters, health crises, terrorism, conflicts, and social unrest) that affect markets, countries, companies, or governments. It is difficult to predict the timing, duration, and potential adverse effects (e.g., portfolio liquidity) of events. Accordingly, you can lose money investing in a portfolio. Fixed-income securities are subject to the ability of an issuer to make timely principal and interest payments (credit risk), changes in interest rates (interest rate risk), the creditworthiness of the issuer and general market liquidity (market risk). In a rising interest-rate environment, bond prices may fall and may result in periods of volatility and increased portfolio redemptions. In a declining interest-rate environment, the portfolio may generate less income. Longer-term securities may be more sensitive to interest rate changes. Certain U.S. government securities purchased by the strategy, such as those issued by Fannie Mae and Freddie Mac, are not backed by the full faith and credit of the U.S. It is possible that these issuers will not have the funds to meet their payment obligations in the future. Public bank loans are subject to liquidity risk and the credit risks of lower-rated securities. High-yield securities (junk bonds) are lower-rated securities that may have a higher degree of credit and liquidity risk. Sovereign debt securities are subject to default risk. Mortgage- and asset-backed securities are sensitive to early prepayment risk and a higher risk of default and may be hard to value and difficult to sell (liquidity risk). They are also subject to credit, market, and interest rate risks. The currency market is highly volatile. Prices in these markets are influenced by, among other things, changing supply and demand for a particular currency; trade; fiscal, money and domestic or foreign exchange control programs and policies; and changes in domestic and foreign interest rates. Investments in foreign markets entail special risks such as currency, political, economic and market risks. The risks of investing in emerging market countries are greater than the risks generally associated with foreign investments. Derivative instruments may disproportionately increase losses and have a significant impact on performance. They also may be subject to counterparty, liquidity, valuation, and correlation and market risks. Restricted and illiquid securities may be more difficult to sell and value than publicly traded securities (liquidity risk). Due to the possibility that prepayments will alter the cash flows on collateralized mortgage obligations (CMOs), it is not possible to determine in advance their final maturity date or average life. In addition, if the collateral securing the CMOs or any third-party guarantees are insufficient to make payments, the portfolio could sustain a loss.
Investing in companies in anticipation of a catalyst event, such as AI adoption, carries the risk that such catalysts may not occur, may be delayed, or that the market may react differently than expected. Companies focused on AI may have limited product lines, markets or financial resources, and their management and performance may be particularly impacted by events that adversely affect AI adoption, such as rapid changes in product technology cycles, product obsolescence, government regulation, cybersecurity concerns and competition.
DEFINITIONS
Basis point (bp): One basis point = 0.01%.
INDEX DEFINITIONS
The indexes shown in this report are not meant to depict the performance of any specific investment, and the indexes shown do not include any expenses, fees, or sales charges, which would lower performance. The indexes shown are unmanaged and should not be considered an investment. It is not possible to invest directly in an index.
“Bloomberg®” and the Bloomberg Index/Indices used are service marks of Bloomberg Finance L.P. and its affiliates and have been licensed for use for certain purposes by Morgan Stanley Investment Management (MSIM). Bloomberg is not affiliated with MSIM, does not approve, endorse, review, or recommend any product, and. does not guarantee the timeliness, accurateness, or completeness of any data or information relating to any product.
The Bloomberg Euro Aggregate Corporate Index (Bloomberg Euro IG Corporate) is an index designed to reflect the performance of the euro-denominated investment-grade corporate bond market.
The Bloomberg Global Aggregate Corporate Index is the corporate component of the Bloomberg Global Aggregate index, which provides a broad-based measure of the global investment-grade fixed income markets.
The Bloomberg US Corporate High Yield Index measures the market of USD-denominated, non-investment grade, fixed-rate, taxable corporate bonds. Securities are classified as high yield if the middle rating of Moody’s, Fitch, and S&P is Ba1/BB+/BB+ or below. The index excludes emerging market debt.
The Bloomberg US Corporate Index is a broad-based benchmark that measures the investment grade, fixed-rate, taxable, corporate bond market.
The Bloomberg US Mortgage-Backed Securities (MBS) Index tracks agency mortgage-backed pass-through securities (both fixed-rate and hybrid ARM) guaranteed by Ginnie Mae (GNMA), Fannie Mae (FNMA) and Freddie Mac (FHLMC). The index is constructed by grouping individual TBA-deliverable MBS pools into aggregates or generics based on program, coupon, and vintage. Introduced in 1985, the GNMA, FHLMC and FNMA fixed-rate indexes for 30- and 15-year securities were backdated to January 1976, May 1977, and November 1982, respectively. In April 2007, agency hybrid adjustable-rate mortgage (ARM) pass-through securities were added to the index.
Consumer Price Index (CPI) is a measure that examines the weighted average of prices of a basket of consumer goods and services, such as transportation, food, and medical care.
Euro vs. USD—Euro total return versus U.S. dollar.
German 10YR bonds—Germany Benchmark 10-Year Datastream Government Index; Japan 10YR government bonds —Japan Benchmark 10-Year Datastream Government Index; and 10YR US Treasury—US Benchmark 10-Year Datastream Government Index.
The ICE BofAML European Currency High-Yield Constrained Index (ICE BofAML Euro HY constrained) is designed to track the performance of euro- and British pound sterling-denominated below investment-grade corporate debt publicly issued in the Eurobond, sterling.
The ICE BofAML US Mortgage-Backed Securities (ICE BofAML US Mortgage Master) Index tracks the performance of US dollar-denominated, fixed-rate and hybrid residential mortgage pass-through securities publicly issued by US agencies in the US domestic market.
The ICE BofAML US High Yield Master II Constrained Index (ICE BofAML US High Yield) is a market value-weighted index of all domestic and Yankee high-yield bonds, including deferred-interest bonds and payment-in-kind securities. Its securities have maturities of one year or more and a credit rating lower than BBB-/Baa3 but are not in default.
The ISM Manufacturing Index is based on surveys of more than 300 manufacturing firms by the Institute of Supply Management. The ISM Manufacturing Index monitors employment, production inventories, new orders, and supplier deliveries. A composite diffusion index is created that monitors conditions in national manufacturing based on the data from these surveys.
Italy 10-Year Government Bonds—Italy Benchmark 10-Year Datastream Government Index.
The JP Morgan CEMBI Broad Diversified Index is a global, liquid corporate emerging markets benchmark that tracks US-denominated corporate bonds issued by emerging markets entities.
The JPMorgan Government Bond Index—emerging markets (JPM local EM debt) tracks local currency bonds issued by emerging market governments. The index is positioned as the investable benchmark that includes only those countries that are accessible by most of the international investor base (excludes China and India as of September 2013).
The JPMorgan Government Bond Index Emerging Markets (JPM External EM Debt) tracks local currency bonds issued by emerging market governments. The index is positioned as the investable benchmark that includes only those countries that are accessible by most of the international investor base (excludes China and India as of September 2013).
The JP Morgan Emerging Markets Bond Index Global (EMBI Global) tracks total returns for traded external debt instruments in the emerging markets and is an expanded version of the EMBI+. As with the EMBI+, the EMBI Global includes US dollar-denominated Brady bonds, loans, and Eurobonds with an outstanding face value of at least $500 million.
The JP Morgan GBI-EM Global Diversified Index is a market-capitalization weighted, liquid global benchmark for US-dollar corporate emerging market bonds representing Asia, Latin America, Europe, and the Middle East/Africa.
JPY vs. USD—Japanese yen total return versus US dollar.
The Markit ITraxx Europe Index comprises 125 equally weighted credit default swaps on investment grade European corporate entities, distributed among 4 sub-indices: Financials (Senior & Subordinated), Non-Financials and HiVol.
The Nikkei 225 Index (Japan Nikkei 225) is a price-weighted index of Japan’s top 225 blue-chip companies on the Tokyo Stock Exchange.
The MSCI AC Asia ex-Japan Index (MSCI Asia ex-Japan) captures large- and mid-cap representation across two of three developed markets countries (excluding Japan) and eight emerging markets countries in Asia.
The MSCI All Country World Index (ACWI, MSCI global equities) is a free float-adjusted market capitalization weighted index designed to measure the equity market performance of developed and emerging markets. The term "free float" represents the portion of shares outstanding that are deemed to be available for purchase in the public equity markets by investors. The performance of the Index is listed in US dollars and assumes reinvestment of net dividends.
MSCI Emerging Markets Index (MSCI emerging equities) captures large- and mid-cap representation across 23 emerging markets (EM) countries.
The MSCI World Index (MSCI developed equities) captures large and mid-cap representation across 23 developed market (DM) countries.
Purchasing Managers Index (PMI) is an indicator of the economic health of the manufacturing sector.
The Refinitiv Convertible Global Focus USD Hedged Index is a market weighted index with a minimum size for inclusion of $500 million (US), 200 million (Europe), 22 billion Yen, and $275 million (Other) of Convertible Bonds with an Equity Link.
The Russell 2000® Index is an index that measures the performance of the 2,000 smallest companies in the Russell 3000 Index.
The S&P 500® Index (US S&P 500) measures the performance of the large-cap segment of the US equities market, covering approximately 75 percent of the US equities market. The index includes 500 leading companies in leading industries of the U.S. economy.
S&P CoreLogic Case-Shiller US National Home Price NSA Index seeks to measure the value of residential real estate in 20 major US metropolitan areas: Atlanta, Boston, Charlotte, Chicago, Cleveland, Dallas, Denver, Detroit, Las Vegas, Los Angeles, Miami, Minneapolis, New York, Phoenix, Portland, San Diego, San Francisco, Seattle, Tampa and Washington, D.C.
The S&P/LSTA US Leveraged Loan 100 Index (S&P/LSTA Leveraged Loan Index) is designed to reflect the performance of the largest facilities in the leveraged loan market.
The S&P GSCI Copper Index (Copper), a sub-index of the S&P GSCI, provides investors with a reliable and publicly available benchmark for investment performance in the copper commodity market.
The S&P GSCI Softs (GSCI soft commodities) Index is a sub-index of the S&P GSCI that measures the performance of only the soft commodities, weighted on a world production basis. In 2012, the S&P GSCI Softs Index included the following commodities: coffee, sugar, cocoa, and cotton.
Spain 10-Year Government Bonds—Spain Benchmark 10-Year Datastream Government Index.
The Thomson Reuters Convertible Global Focus USD Hedged Index is a market weighted index with a minimum size for inclusion of $500 million (US), 200 million euro (Europe), 22 billion yen, and $275 million (Other) of convertible bonds with an equity link.
U.K. 10YR government bonds—U.K. Benchmark 10-Year Datastream Government Index. For the following Datastream government bond indexes, benchmark indexes are based on single bonds. The bond chosen for each series is the most representative bond available for the given maturity band at each point in time. Benchmarks are selected according to the accepted conventions within each market. Generally, the benchmark bond is the latest issue within the given maturity band; consideration is also given to yield, liquidity, issue size and coupon.
The US Dollar Index (DXY) is an index of the value of the United States dollar relative to a basket of foreign currencies, often referred to as a basket of US trade partners’ currencies.
The Chicago Board Options Exchange (CBOE) Market Volatility (VIX) Index shows the market’s expectation of 30-day volatility.
There is no guarantee that any investment strategy will work under all market conditions, and each investor should evaluate their ability to invest for the long-term, especially during periods of downturn in the market.
A separately managed account may not be appropriate for all investors. Separate accounts managed according to the particular strategy may include securities that may not necessarily track the performance of a particular index. Please consider the investment objectives, risks and fees of the Strategy carefully before investing. A minimum asset level is required. For important information about the investment managers, please refer to Form ADV Part 2.
The views and opinions and/or analysis expressed are those of the author or the investment team as of the date of preparation of this material and are subject to change at any time without notice due to market or economic conditions and may not necessarily come to pass. Furthermore, the views will not be updated or otherwise revised to reflect information that subsequently becomes available or circumstances existing, or changes occurring, after the date of publication. The views expressed do not reflect the opinions of all investment personnel at Morgan Stanley Investment Management (MSIM) and its subsidiaries and affiliates (collectively “the Firm”) and may not be reflected in all the strategies and products that the Firm offers.
Forecasts and/or estimates provided herein are subject to change and may not actually come to pass. Information regarding expected market returns and market outlooks is based on the research, analysis and opinions of the authors or the investment team. These conclusions are speculative in nature, may not come to pass and are not intended to predict the future performance of any specific strategy or product the Firm offers. Future results may differ significantly depending on factors such as changes in securities or financial markets or general economic conditions.
This material has been prepared on the basis of publicly available information, internally developed data and other third-party sources believed to be reliable. However, no assurances are provided regarding the reliability of such information and the Firm has not sought to independently verify information taken from public and third-party sources.
This material is a general communication, which is not impartial, and all information provided has been prepared solely for informational and educational purposes and does not constitute an offer or a recommendation to buy or sell any particular security or to adopt any specific investment strategy. The information herein has not been based on a consideration of any individual investor circumstances and is not investment advice, nor should it be construed in any way as tax, accounting, legal or regulatory advice. To that end, investors should seek independent legal and financial advice, including advice as to tax consequences, before making any investment decision.
Charts and graphs provided herein are for illustrative purposes only. Past performance is no guarantee of future results.
The indexes are unmanaged and do not include any expenses, fees, or sales charges. It is not possible to invest directly in an index. Any index referred to herein is the intellectual property (including registered trademarks) of the applicable licensor. Any product based on an index is in no way sponsored, endorsed, sold, or promoted by the applicable licensor and it shall not have any liability with respect thereto.
This material is not a product of Morgan Stanley’s Research Department and should not be regarded as a research material or a recommendation.
The Firm has not authorized financial intermediaries to use and to distribute this material unless such use and distribution is made in accordance with applicable law and regulation. Additionally, financial intermediaries are required to satisfy themselves that the information in this material is appropriate for any person to whom they provide this material in view of that person’s circumstances and purpose. The Firm shall not be liable for, and accepts no liability for, the use or misuse of this material by any such financial intermediary.
This material may be translated into other languages. Where such a translation is made this English version remains definitive. If there are any discrepancies between the English version and any version of this material in another language, the English version shall prevail.
The whole or any part of this material may not be directly or indirectly reproduced, copied, modified, used to create a derivative work, performed, displayed, published, posted, licensed, framed, distributed, or transmitted or any of its contents disclosed to third parties without the Firm’s express written consent. This material may not be linked to unless such hyperlink is for personal and non-commercial use. All information contained herein is proprietary and is protected under copyright and other applicable law.
Eaton Vance is part of Morgan Stanley Investment Management. Morgan Stanley Investment Management is the asset management division of Morgan Stanley.
DISTRIBUTION
This material is only intended for and will only be distributed to persons resident in jurisdictions where such distribution or availability would not be contrary to local laws or regulations.
MSIM, the asset management division of Morgan Stanley (NYSE: MS), and its affiliates have arrangements in place to market each other’s products and services. Each MSIM affiliate is regulated as appropriate in the jurisdiction it operates. MSIM’s affiliates are: Calvert Research and Management, Eaton Vance Management, Parametric Portfolio Associates LLC, Parametric SAS, and Atlanta Capital Management LLC.
This material has been issued by any one or more of the following entities:
EMEA:
This material is for Professional Clients/Accredited Investors only.
In the EU, MSIM materials are issued by MSIM Fund Management (Ireland) Limited (“FMIL”). FMIL is regulated by the Central Bank of Ireland and is incorporated in Ireland as a private company limited by shares with company registration number 616661 and has its registered address at 24-26 City Quay, Dublin 2, DO2 NY19, Ireland.
Outside the EU, MSIM materials are issued by Morgan Stanley Investment Management Limited (MSIM Ltd) is authorised and regulated by the Financial Conduct Authority. Registered in England. Registered No. 1981121. Registered Office: 25 Cabot Square, Canary Wharf, London E14 4QA.
In Switzerland, MSIM materials are issued by Morgan Stanley & Co. International plc, London (Zurich Branch) Authorised and regulated by the Eidgenössische Finanzmarktaufsicht ("FINMA"). Registered Office: Beethovenstrasse 33, 8002 Zurich, Switzerland.
Italy: MSIM FMIL (Milan Branch), (Sede Secondaria di Milano) Palazzo Serbelloni Corso Venezia, 16 20121 Milano, Italy. The Netherlands: MSIM FMIL (Amsterdam Branch), Rembrandt Tower, 11th Floor Amstelplein 1 1096HA, Netherlands. France: MSIM FMIL (Paris Branch), 61 rue de Monceau 75008 Paris, France. Spain: MSIM FMIL (Madrid Branch), Calle Serrano 55, 28006, Madrid, Spain. Germany: MSIM FMIL Frankfurt Branch, Große Gallusstraße 18, 60312 Frankfurt am Main, Germany (Gattung: Zweigniederlassung (FDI) gem. § 53b KWG). Denmark: MSIM FMIL (Copenhagen Branch), Gorrissen Federspiel, Axel Towers, Axeltorv2, 1609 Copenhagen V, Denmark.
MIDDLE EAST
Dubai International Financial Centre: This information does not constitute or form part of any offer to issue or sell, , any investment products in the UAE (including the Dubai International Financial Centre and the Abu Dhabi Global Market) and accordingly should not be construed as such. The content of this report has not been approved by or filed with the UAE Central Bank, the Dubai Financial Services Authority, the UAE Securities and Commodities Authority or the Financial Services Regulatory Authority.
Abu Dhabi Global Market (“ADGM”): This material is sent strictly within the context of, and constitutes, an Exempt Communication. This material relates to (strategy) which is not subject to any form of regulation or approval by the Financial Services Regulatory Authority of the Abu Dhabi Global Market (the “FSRA”).
Saudi Arabia: This financial promotion was issued and approved for use in Saudi Arabia by Morgan Stanley Saudi Arabia, Al Rashid Tower, Kings Sand Street, Riyadh, Saudi Arabia, authorized and regulated by the Capital Market Authority license number 06044-37.
US
NOT FDIC INSURED | OFFER NO BANK GUARANTEE | MAY LOSE VALUE | NOT INSURED BY ANY FEDERAL GOVERNMENT AGENCY | NOT A DEPOSIT
Latin America (Brazil, Chile Colombia, Mexico, Peru, and Uruguay)
This material is for use with an institutional investor or a qualified investor only. All information contained herein is confidential and is for the exclusive use and review of the intended addressee and may not be passed on to any third party. This material is provided for informational purposes only and does not constitute a public offering, solicitation, or recommendation to buy or sell for any product, service, security and/or strategy. A decision to invest should only be made after reading the strategy documentation and conducting in-depth and independent due diligence.
ASIA PACIFIC
Hong Kong: This document has been issued by Morgan Stanley Asia Limited, CE No. AAD291, for use in Hong Kong and shall only be made available to “professional investors” as defined under the Securities and Futures Ordinance of Hong Kong (Cap 571). The contents of this document have not been reviewed nor approved by any regulatory authority including the Securities and Futures Commission in Hong Kong. Accordingly, save where an exemption is available under the relevant law, this document shall not be issued, circulated, distributed, directed at, or made available to, the public in Hong Kong.
Singapore This material is disseminated in Singapore by Morgan Stanley Investment Management Company, Registration No. 199002743C. This material should not be considered to be the subject of an invitation for subscription or purchase, whether directly or indirectly, to the public or any member of the public in Singapore other than (i) to an institutional investor under section 304 of the Securities and Futures Act, Chapter 289 of Singapore (“SFA”), (ii) to a “relevant person” (which includes an accredited investor) pursuant to section 305 of the SFA, and such distribution is in accordance with the conditions specified in section 305 of the SFA; or (iii) otherwise pursuant to, and in accordance with the conditions of, any other applicable provision of the SFA. This material has not been reviewed by the Monetary Authority of Singapore.
Australia: This material is provided by Morgan Stanley Investment Management (Australia) Pty Ltd ABN 22122040037, AFSL No. 314182 and its affiliates and does not constitute an offer of interests. Morgan Stanley Investment Management (Australia) Pty Limited arranges for MSIM affiliates to provide financial services to Australian wholesale clients. This material will not be lodged with the Australian Securities and Investments Commission.
Japan: For professional investors, this material is circulated or distributed solely for informational purposes. For non-professional investors, this material is provided in connection with Morgan Stanley Investment Management (Japan) Co., Ltd. (“MSIMJ”)’s business with respect to discretionary investment management agreements (“IMA”) and investment advisory agreements (“IAA”). This does not constitute a recommendation or solicitation of transactions nor offers any particular financial instruments. Under an IMA, with respect to the management of client assets, the client prescribes basic management policies in advance and commissions MSIMJ to make all investment decisions based on an analysis of the value, etc. of the securities, and MSIMJ accepts such commission. The client shall delegate to MSIMJ the authorities necessary to make such investment decisions. MSIMJ exercises these delegated authorities accordingly, and the client shall not make individual instructions. All investment profits and losses belong to the clients; principal is not guaranteed. Please consider the investment objectives and nature of risks before investing. As an investment advisory fee for an IAA or an IMA, the amount of assets subject to the contract multiplied by a certain rate (the upper limit is 2.20% per annum (including tax)) shall be incurred in proportion to the contract period. For some strategies, a contingency fee may be incurred in addition to the fee mentioned above. Indirect charges also may be incurred, such as brokerage commissions for underlying securities. Since these charges and expenses vary by contract and other factors, MSIMJ cannot present the rates, upper limits, etc. in advance. All clients should read thoroughly the Documents Provided Prior to the Conclusion of a Contract carefully before executing an agreement. This material is distributed in Japan by MSIMJ, Registered No. 410 (Director of Kanto Regional Finance Bureau (Financial Instruments Firms)), Membership: the Japan Securities Dealers Association, the Investment Management Association of Japan and the Type II Financial Instruments Firms Association.


