Wealth Management — November 5, 2026

What Happened in the Markets?
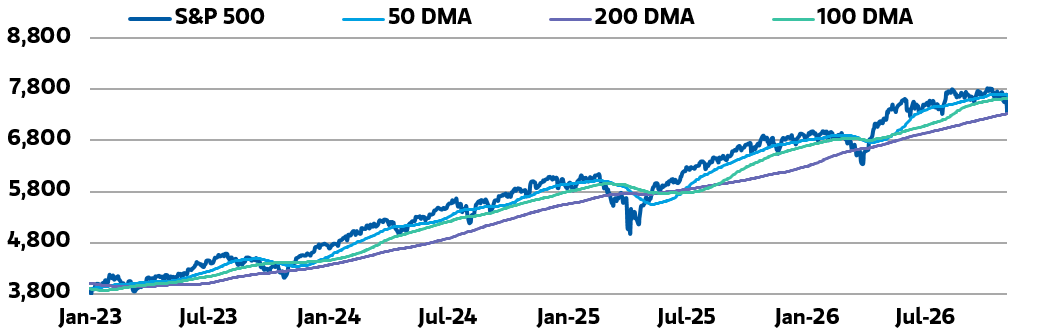
- The S&P 500 fell 4.4% Thursday to end the day at 7,353.73, having gained 7.4% thus far in 2026.
- All eleven S&P 500 sectors declined on the day, as Consumer Staples (-0.7%) and Utilities (-0.7%) were the strongest-performing S&P 500 sectors, while Industrials (-4.1%) and Information Technology (-7.3%) underperformed.
- By the 4:00 p.m. equity market close, the US 10-year Treasury yield fell 5 bp to 4.84%; WTI Crude fell to $91.05 per barrel; and gold rose to 4,089.58 per ounce.
Why Did This Move Happen?
- US equities plunged Thursday, with the S&P 500 more than reversing Wednesday’s post-election rally and posting its worst day since April 2025. Semiconductor, data center, and megacap tech names led declines. Growing concerns about government scrutiny of AI capital expenditures fueled risk-off sentiment, while heightened volatility accelerated liquidation of certain hedged strategies' long positions.
- US Treasuries rallied on safe-haven demand, despite lower-than-expected initial jobless claims, with the 10-year Treasury yield falling 5 bp to 4.84%.
- Brent crude oil rebounded to around $99/bbl., recouping part of Wednesday’s nearly 9% drop amid renewed uncertainty over the US-Iran conflict. The US Dollar Index (DXY) finished little changed, gold rose 1% to a two-week high, and bitcoin fell 5.2% to around $76,000.
S&P 500 vs. 50-, 100-, and 200-Day Moving Averages
How Does the Move Relate to Our Tactical Positioning?
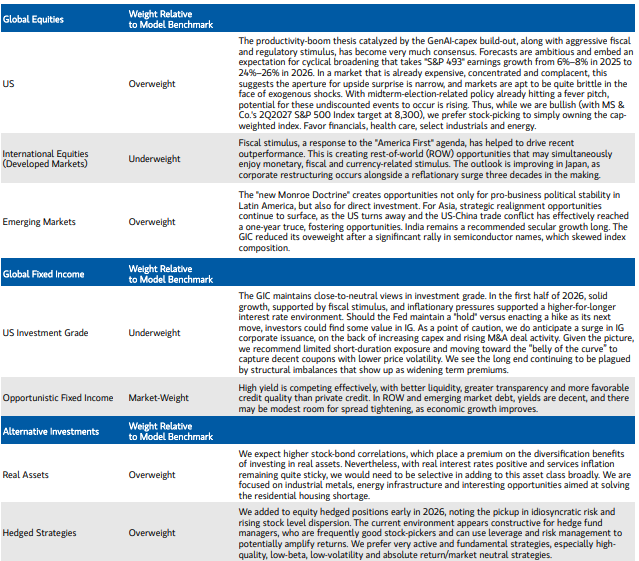
- The GIC recommends preparing for a solid-but-slowing US backdrop, emphasizing US large-cap ‘quality’ across both growth and value, while erring on the side of asset class diversification. With megacap and large-cap leadership likely to persist and a policy/productivity backdrop that favors strong fundamentals, we prefer core fixed income in the "belly of the curve" over short duration. We continue to use real assets and hedge funds to help mitigate emerging risks. The GIC consistently re-assesses its outlook in light of incoming data points.
- Please find more information on the GIC's tactical positioning on the next two pages and reach out to your Morgan Stanley Financial Advisor to discuss portfolio strategies.
The Global Investment Committee's Tactical Asset Allocation Reasoning
Morgan Stanley & Co.’s Key Market Forecasts: 2Q2027
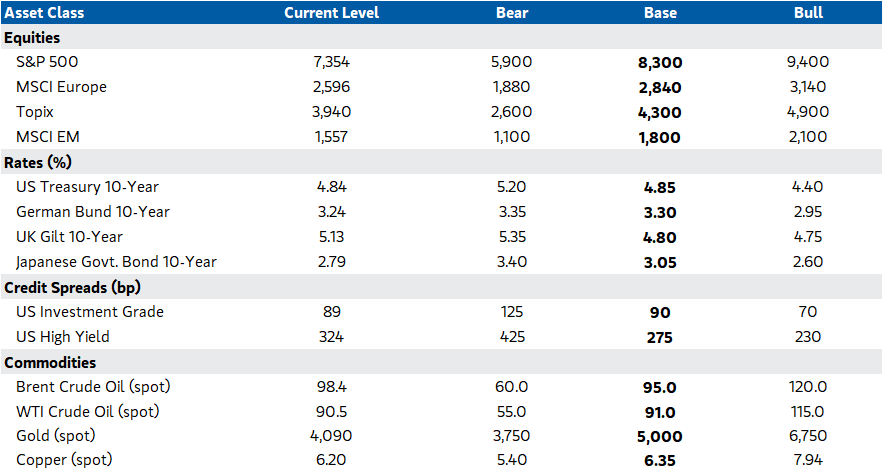
Market data provided by Bloomberg.
Dow Jones Industrial Average (DJIA): A price-weighted average of 30 blue-chip stocks that are generally the leaders in their industry.
NASDAQ Composite Index: A broad-based capitalization-weighted index of stocks in all three NASDAQ tiers: Global Select, Global Market and Capital Market.
S&P 500 Index: The Standard & Poor's (S&P) 500 Index tracks the performance of 500 widely held, large-capitalization US stocks.
US Trade-Weighted Dollar Index: A weighted average of the foreign exchange value of the 17US dollar against a subset of the broad index currencies that circulate widely outside the US.
Hedged Strategy Definitions
Absolute return: This type of investing describes a category of investment strategies and mutual funds that seek to earn a positive return over time—regardless of whether markets are going up, down, or sideways—and to do so with less volatility than stocks.
Equity Hedge is a hedge fund investment strategy with a typical goal of providing equity-like returns while limiting the impact of downside market movements and volatility on an investor's portfolio. Managers utilize long and short positions, primarily in equity and equity-related instruments, to achieve this goal.
Equity Market Neutral: This strategy employs sophisticated quantitative techniques of analyzing price data to ascertain information about future price movement and relationships between securities, and select securities for purchase and sale. These can include both factor-based and statistical arbitrage/trading strategies. Factor-based investment strategies include strategies in which the investment thesis is predicated on the systematic analysis of common relationships between securities. In many but not all cases, portfolios are constructed to be neutral to one or multiple variables, such as broader equity markets in dollar or beta terms, and leverage is frequently employed to enhance the return profile of the positions identified. Statistical arbitrage/trading strategies consist of strategies in which the investment thesis is predicated on exploiting pricing anomalies which may occur as a function of expected mean reversion inherent in security prices; high frequency techniques may be employed and trading strategies may also be employed on the basis of technical analysis or opportunistically to exploit new information the investment manager believes has not been fully, completely or accurately discounted into current security prices. Equity market neutral strategies typically maintain characteristic net equity market exposure no greater than 10% long or short.