Wealth Management — March 31, 2026

Source: Bloomberg, Morgan Stanley Wealth Management Global Investment Office (GIO). Data as of March 31, 2026.
What Happened in the Markets?
- The S&P 500 rose 2.9% Tuesday to end the day at 6,528.52 having lost 4.6% thus far in 2026.
- Nine of 11 S&P 500 sectors were higher on the day, as Communication Services (4.4%) and Information Technology (4.2%) were the strongest-performing S&P 500 sectors, while Utilities (-0.1%) and Energy (-1.1%) underperformed.
- By the 4:00 p.m. equity market close, the US 10-year Treasury yield decreased to 4.32%; WTI Crude decreased to $101.96 per barrel; and gold increased to $4,678.26 per ounce.
Why Did This Move Happen?
- US equities rallied almost 3% Tuesday, registering the largest single-day advance since last May amid hopes that the US-Iran conflict may be nearing an end. Momentum, growth, and high-beta factors outperformed as reports that the President was willing to end the military campaign, even if the Strait of Hormuz were to remain closed, circulated.
- Crude oil prices declined, retreating along with the US dollar, as investors welcomed growing speculation around conflict off-ramps. US Treasuries extended the prior session’s advance, with two-year yields falling 3 bp to 3.79%, while 10-year yields declined 3 bp, to 4.32%.
- Conference Board Consumer Confidence unexpectedly improved in March, with the headline index rising to 91.8, supported by a more upbeat view on business and labor market conditions. Meanwhile, February’s JOLTS data came in slightly cooler-than-expected, even as conditions remained broadly stable from January's readings.
S&P 500 vs. 50-, 100-, and 200-Day Moving Averages
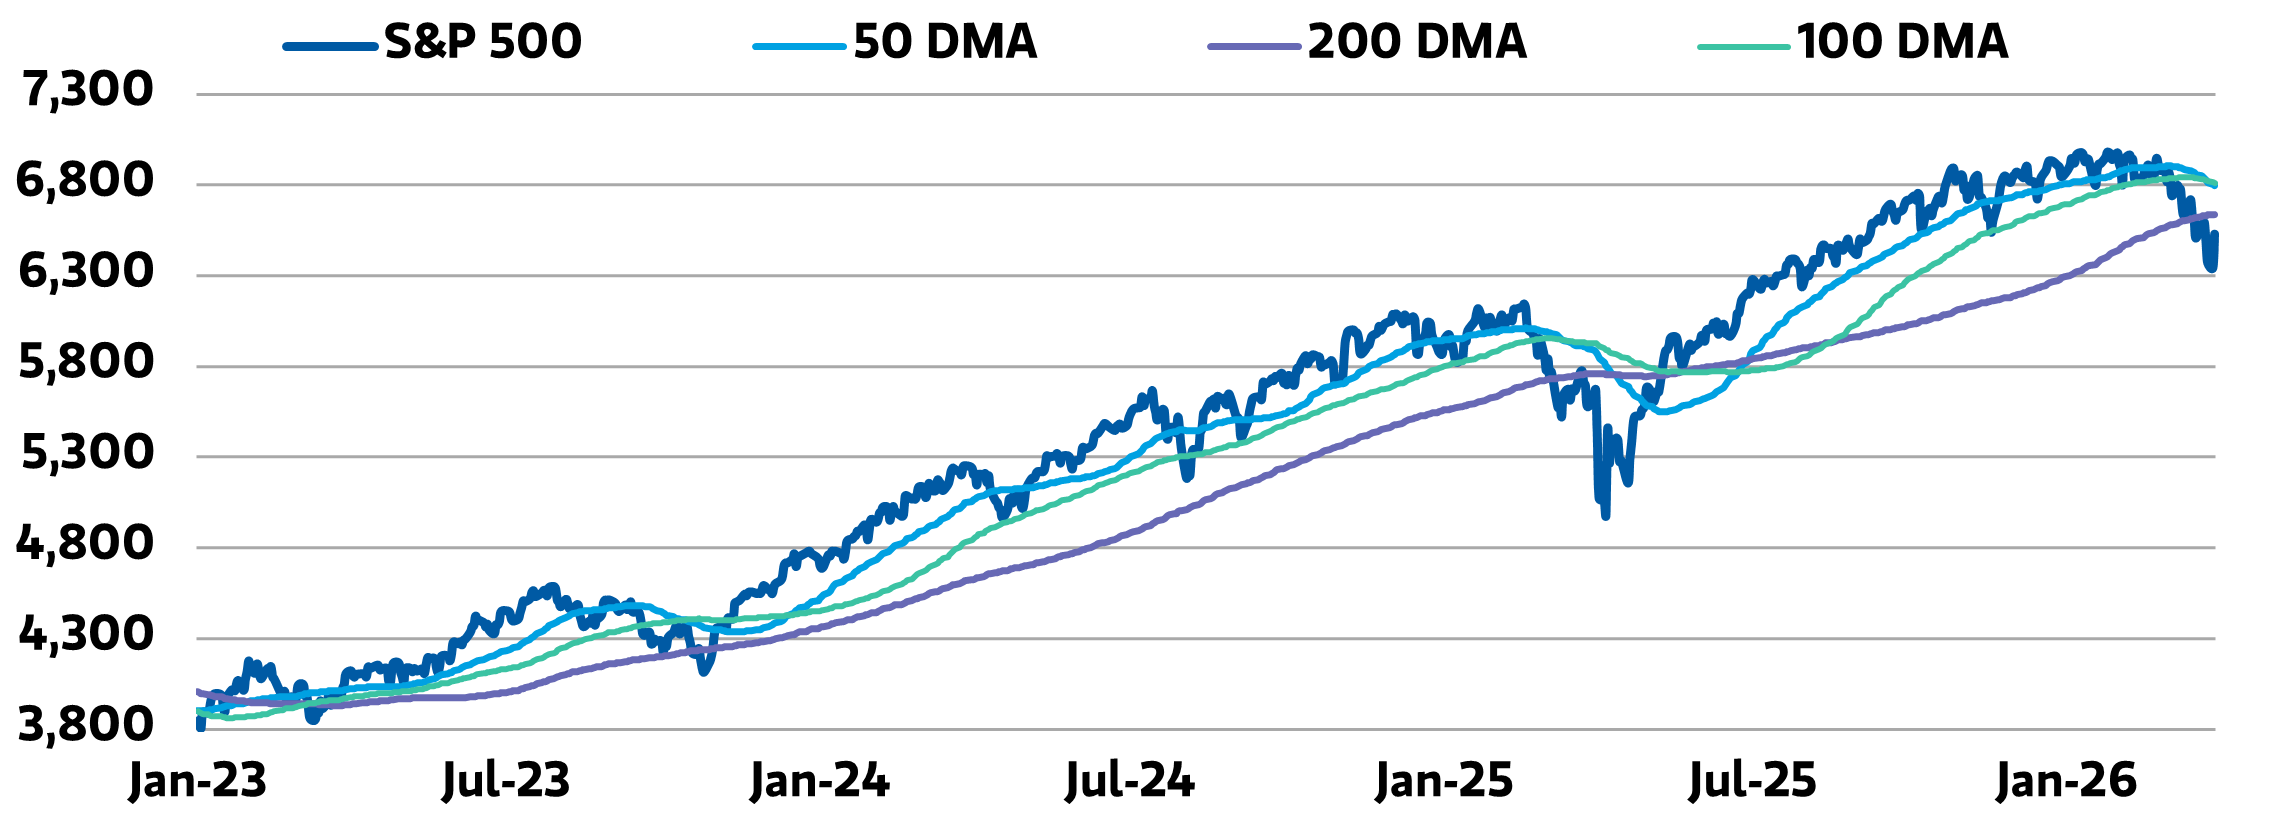
Source: Bloomberg and Morgan Stanley Wealth Management GIO. Data as of March 31, 2026.
How Does the Move Relate to Our Tactical Positioning?
- The GIC recommends preparing for a solid-but-slowing US backdrop, emphasizing US large-cap ‘quality’ across both growth and value, while erring on the side of asset class diversification. With megacap and large-cap leadership likely to persist and a policy/productivity backdrop that favors strong fundamentals, we prefer core fixed income in the "belly of the curve" over short duration. We continue to use real assets and hedge funds to help mitigate emerging risks. The GIC consistently re-assesses its outlook in light of incoming data points.
- Please find more information on the GIC's tactical positioning on the next two pages and reach out to your Morgan Stanley Financial Advisor to discuss portfolio strategies.
The Global Investment Committee's Tactical Asset Allocation Reasoning

Note: Opportunistic Fixed Income includes Inflation-Linked Securities, High Yield Fixed Income, International Fixed Income, and Emerging Market Fixed Income. The GIC asset allocation models’ benchmarks do not include exposure to Opportunistic Fixed Income. Real Assets includes Real Estate/REITs, Commodities, and Energy Infrastructure/MLPs. Hedged Strategies include Absolute Return Assets, Equity Hedge Assets, and Equity Return Assets.
Source: Morgan Stanley Wealth Management GlC as of Jan. 15, 2026.
Morgan Stanley & Co.’s Key Market Forecasts
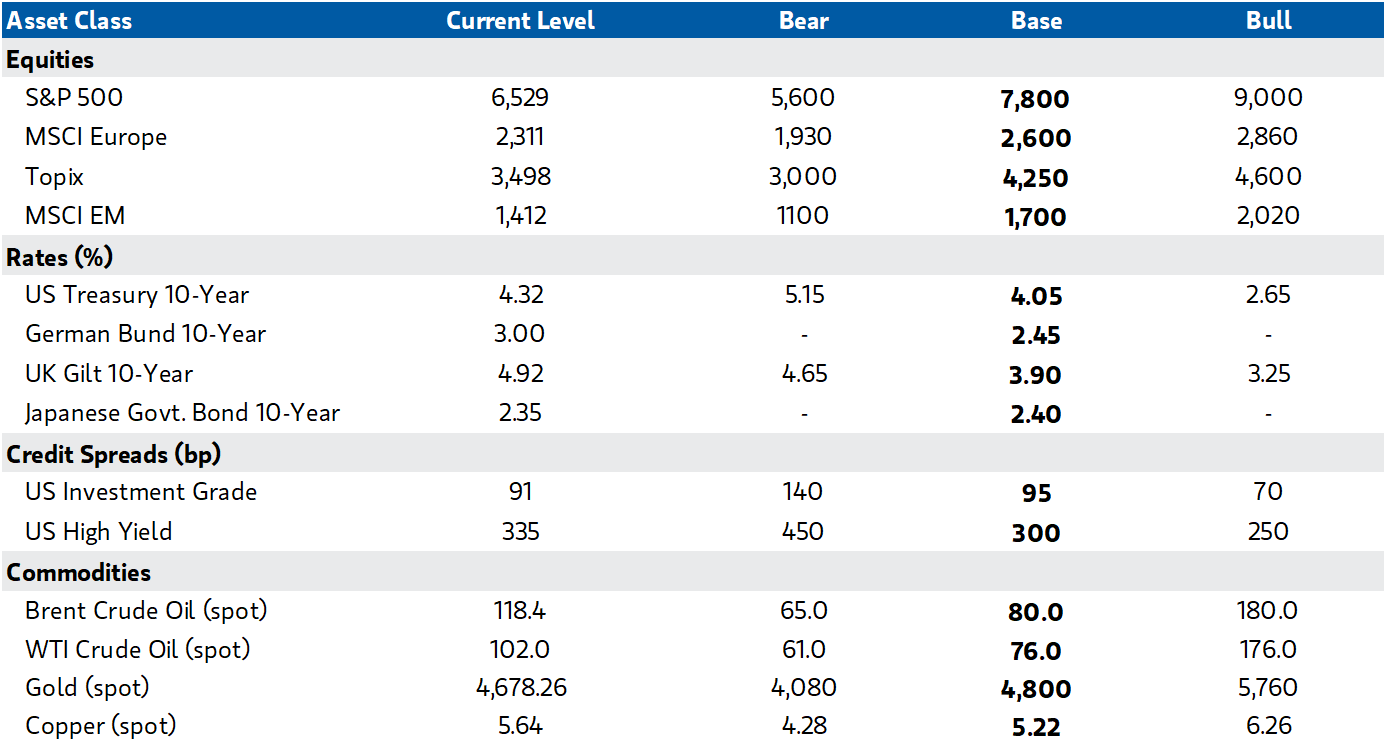
Source: Bloomberg, Morgan Stanley Wealth Management GIO. Data as of March 31, 2026.
Market data provided by Bloomberg.
Dow Jones Industrial Average (DJIA): A price-weighted average of 30 blue-chip stocks that are generally the leaders in their industry.
NASDAQ Composite Index: A broad-based capitalization-weighted index of stocks in all three NASDAQ tiers: Global Select, Global Market and Capital Market.
S&P 500 Index: The Standard & Poor's (S&P) 500 Index tracks the performance of 500 widely held, large-capitalization US stocks.
US Trade-Weighted Dollar Index: A weighted average of the foreign exchange value of the 17US dollar against a subset of the broad index currencies that circulate widely outside the US.


